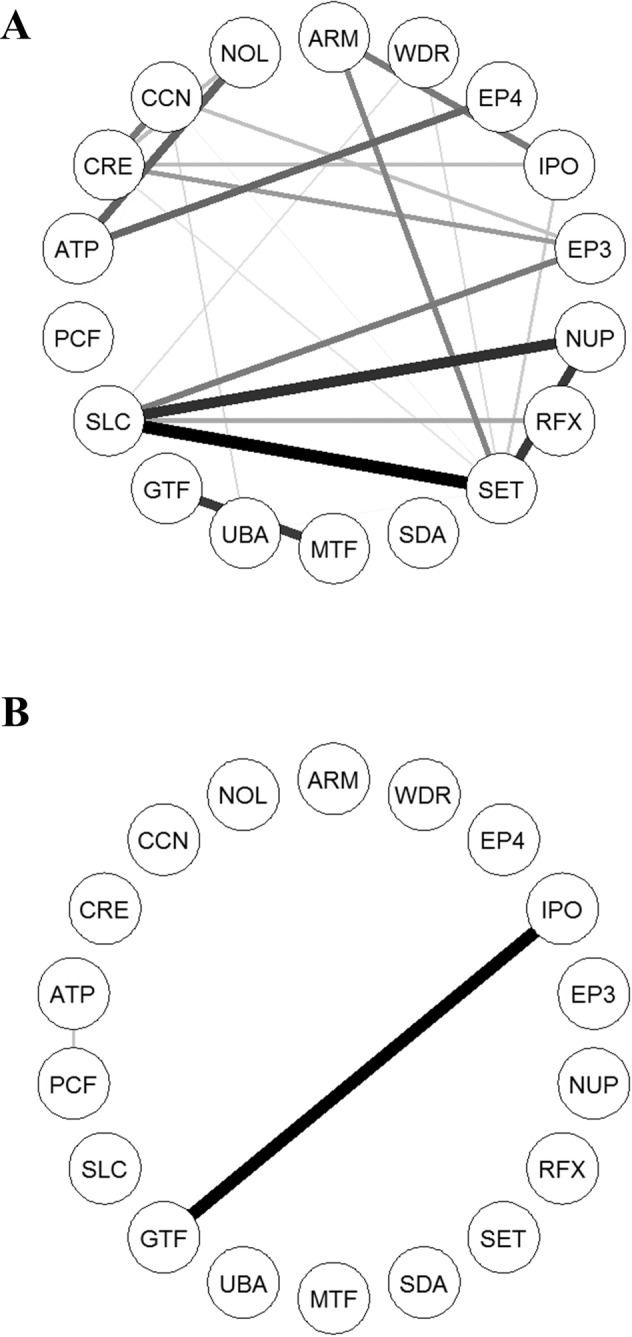
Figure 4.

Co-expression network of hub genes of the bone mineral density Z score-associated common module. (A) Sham-treated IBCs from childhood asthmatics. (B) Dex-treated IBCs from childhood asthmatics. For clarity, only the edges corresponding to the Pearson correlation coefficient >0.8 were shown. The edge width is proportional to the Pearson correlation coefficient between two nodes. The network was visualized using qgraph R package. ARM, ARMC5; ATP, ATP2A2; CCN, CCNK; CRE, CREBBP; EP3, EP300; EP4, EP400; GTF, GTF3C1; IPO, IPO13; MTF, MTF1; NOL, NOL8; NUP, NUP188; PCF, PCF11; RFX, RFX5; SDA, SDAD1; SET, SETD1A; SLC, SLC25A22; UBA, UBAP2L; WDR, WDR59.
