Figure 4.
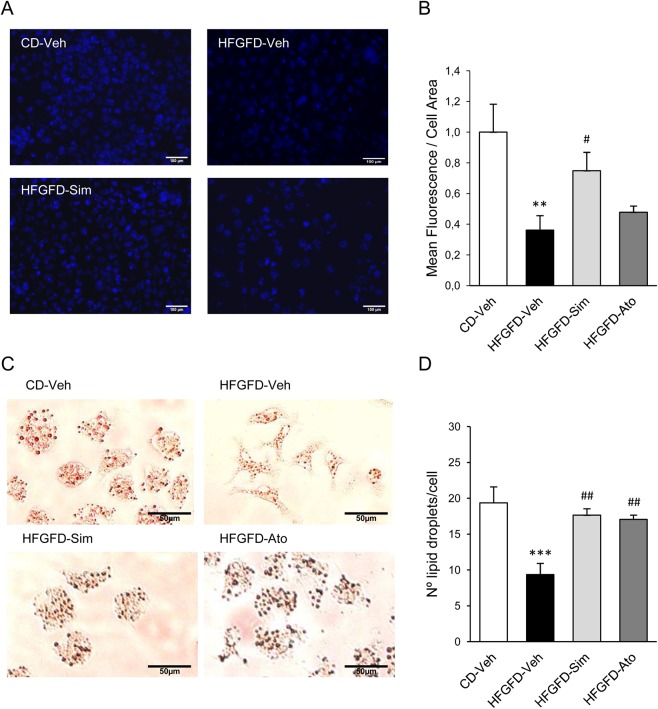
Detection of vitamin A in HSC. Stored Vitamin A quatitation in primary isolated HSCs from control diet (CD-Veh, n = 5) and HFGFD rats after vehicle (HFGFD-Veh, n = 5), simvastatin (HFGFD-Sim, n = 5) or atorvastatin (HFGFD-Ato, n = 5) treatment. (A) Representative images of freshly isolated HSCs visualized using vitamin A autofluorescence. (B) Quantification of mean autofluorescence/cell area. (C) Representative images of Oil Red O staining of HSCs. (D) Number of lipid droplets/cell. Values are expressed as mean ± SEM; **p < 0.01, ***p < 0,001 compared to CD-Veh; #p < 0.05, ##p < 0.01 compared to HFGFD-Veh (ANOVA).

