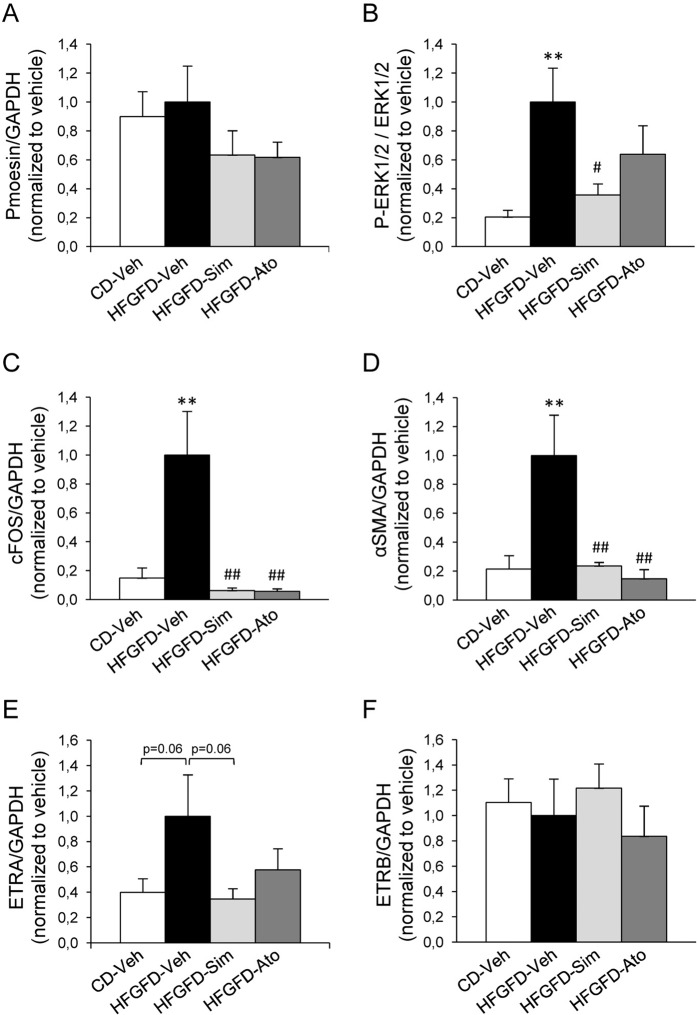
Figure 5.
Endothelin pathway markers in HSC. Bar diagrams show protein quantification of (A) P-moesin, (B) P-ERK1/2 (C) cFOS (D) αSMA (E) ETRA and (F) ETRB in HSC from control diet (CD-Veh, n = 5), and high-fat glucose-fructose diet rats treated with vehicle (HFGFD-Veh, n = 5), simvastatin (HFGFD-Sim, n = 5) or atorvastatin (HFGFD-Ato, n = 5). Full-length gels are included in Supplementary Fig. 5. GAPDH was used as loading control. Protein levels are normalized to HFGFD-Veh group and expressed as mean ± SEM. **p < 0.01 compared to CD-Veh; #p < 0.05, ##p < 0.01 compared to HFGFD-Veh (ANOVA).

