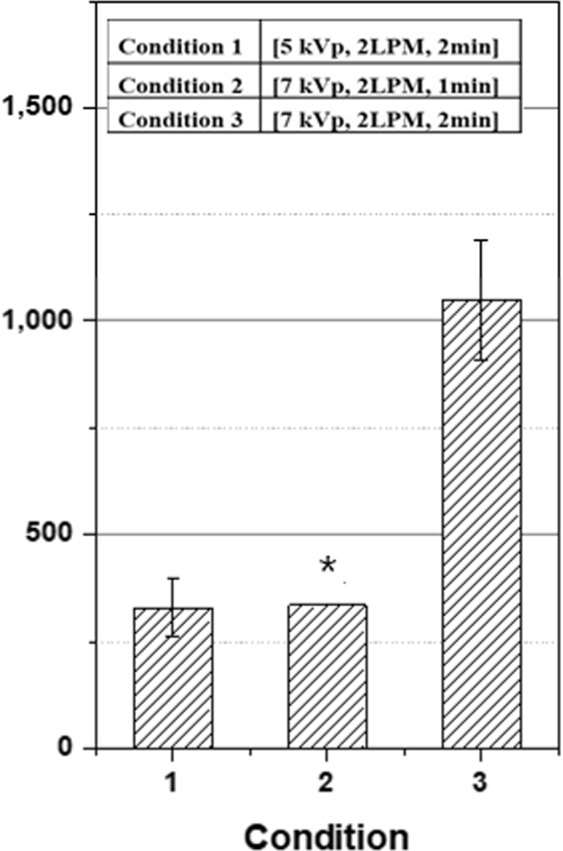
Figure 4.

DMPO-OH signal intensities in an arbitrary unit from plasma treatments at three different operational setups of the plasma device in applied voltage, helium flow rate, and duration of treatment. The asterisked data for condition 2 was extrapolated from the data in Fig. 3(b). The data sets were normalized by external Mn2+ signal intensities. Each error bar indicates one standard error of the mean obtained from three independent experiments.
