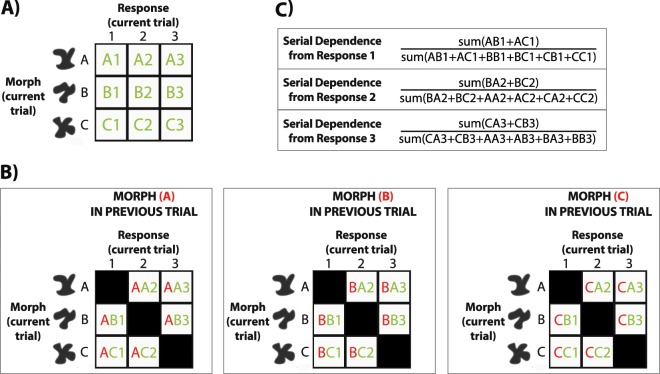
Figure 2.
Temporal tuning analysis in Experiments 1 and 2. (A) We divided observers’ response frequency into a 3 × 3 matrix based on their responses 1/2/3 and the actual object category (A/B/C) on a current trial. (B) We then divided observers’ mistakes into three matrixes depending on whether the previous objects category was (A/B/C). First letter (in red) indicates morph category on the previous trial, second letter indicates morph category on the current trial (in green), and the number indicates classification response on a current trial (in green). Only mistakes were considered and hits were not taken into account (black squares on the diagonal line). (C) For a given response (1, for example), we summed mistakes when response and previous category were the same (AB1,AC1), and divided them by the sum of all the mistakes (AB1,AC1,BB1,BC1,CB1,CC1). This ratio yielded an index of serial dependence for a given responses (1 in this example). We then averaged the indexes across the three responses 1/2/3 and subtracted the chance baseline (33%).

