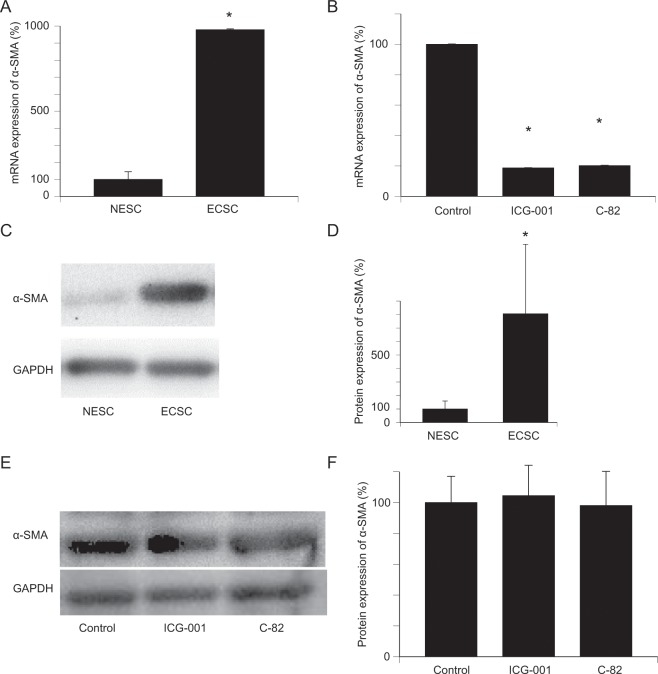
Figure 4.
Expression of α-SMA is significantly upregulated in ECSC, and downregulated by ICG-001 and C-82. (A) The mRNA expression of α-SΜΑ was significantly upregulated in ECSC compared with NESC. n = 4. *p < 0.01, Student’s t-test. (B) mRNA expression of α-SΜΑ in ECSC was significantly downregulated by ICG-001 and C-82. n = 4. *p < 0.001, Student’s t-test. (C,D) Western blot analysis of α-SMA showed that protein expression of α-SMA was significantly upregulated in ECSC compared with NESC. n = 3. *p < 0.01, Student’s t-test. (E,F) Western blot analysis of α-SMA in control, ICG-001, and C-82 groups. There was no significant difference in the protein expression of α-SMA between the untreated control group and CBP/β-catenin inhibitor-treated groups by Student’s t-test. n = 4. Error bars represent standard deviation (SD). Uncropped images are shown in Figs. S6 and S7.

