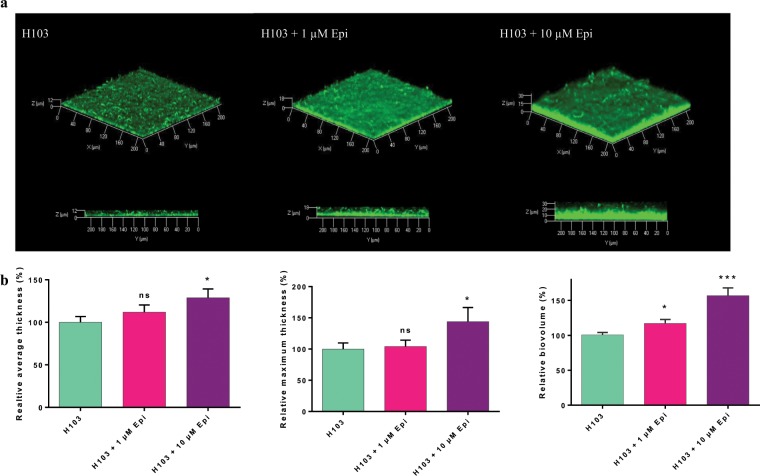
Figure 4.
Effect of Epi on P. aeruginosa H103 biofilm formation. (a) Three dimensional (3D) and side views of P. aeruginosa H103-GFP 24 h biofilm observed by CLSM, in presence of 1 or 10 µM of Epi. (b) Images analysis by COMSTAT. Data were normalized according to the untreated control set at 100%. The error bars indicate the standard error of the mean (SEM) of at least three independent experiments. Two-tailed paired t-test was used (n = 4), *p < 0.05, ***p < 0.001, ns: not significant.

