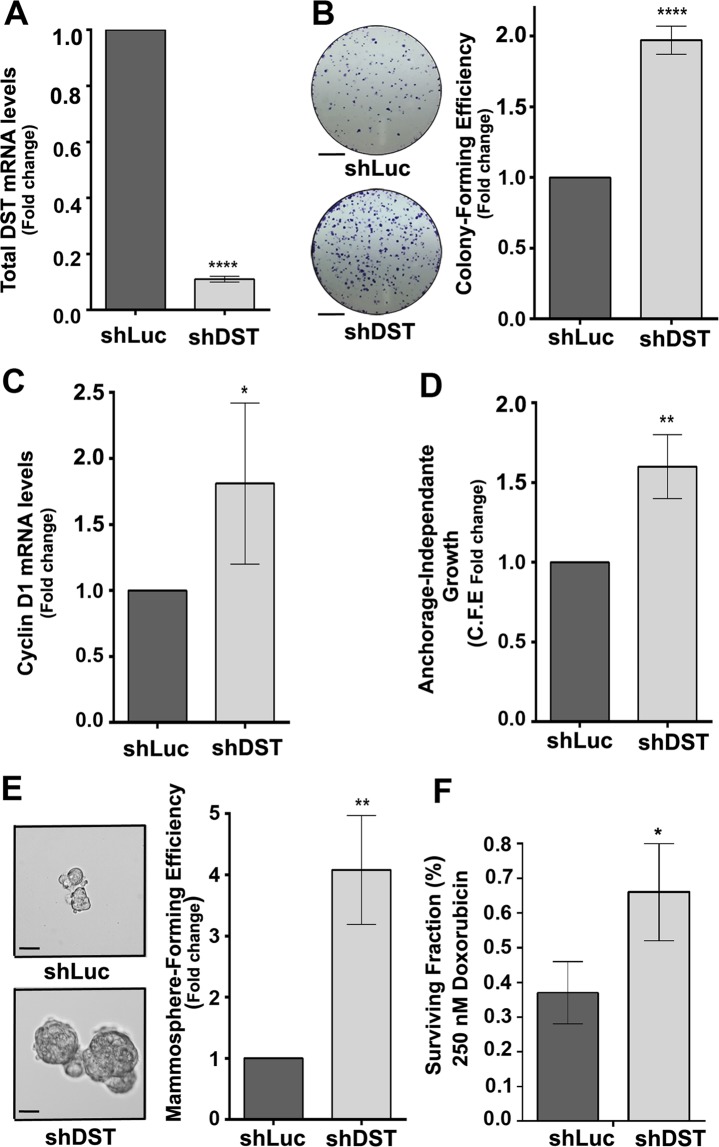
Figure 2.
Knocking down DST is sufficient to induce the acquisition of transformed features to MCF10A cells. (A) Fold change of total DST mRNA levels between shLuc- and shDST-expressing MCF10A cells, normalized to GAPDH. Data are from four biological replicates performed in triplicates. (B) (left panels) Representative images of colonies from shLuc- or shDST-expressing MCF10A cells grown in clonogenic assays. Scale bars represent 5 mm. (Right panel) Fold change in colony-forming efficiency between shLuc- and shDST-expressing MCF10A cells. Data are from three biological replicates performed in triplicates. (C) Fold change in Cyclin D1 mRNA levels between shLuc- and shDST-expressing MCF10A cells. Data are from four biological replicates performed in triplicates. (D) Fold change in colony-forming efficiency (C.F.E.) between shLuc- and shDST-expressing MCF10A cells grown in soft agar. Data are from three biological replicates performed in triplicates. (E) (Left panels) Representative images of shLuc- or shDST-expressing MCF10A mammospheres. Scale bars represent 50 μm. (Right panel) Fold change in mammosphere-forming efficiency between shLuc- and shDST-expressing MCF10A cells. Data are from three biological replicates performed in triplicates. (F) Percentage (%) of surviving shLuc- or shDST-expressing MCF10A cells, treated with 250 nM of Doxorubicin. Data are from three biological replicates performed in triplicates. For all quantifications, error bars indicate SD.; *indicates P < 0.05; **indicates P < 0.005; ****indicates P < 0.0001.

