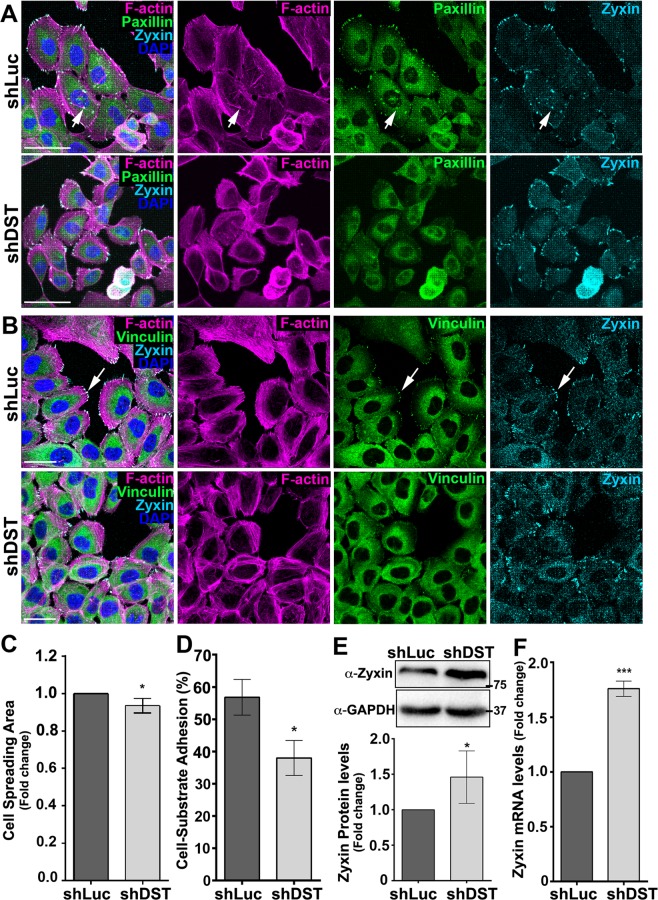
Figure 3.
Knocking down DST affects FAs and cell-substratum adhesion. (A,B) Standard confocal sections of shLuc- or shDST-expressing MCF10A cells, stained with Phalloidin (Magenta) to mark F-actin, DAPI (Blue) to mark nuclei, anti-Zyxin (Cyan blue) and (A) anti-Paxillin (Green) or (B) anti-Vinculin. Scale bars represent (A) 50 µm or (B) 30 µm. (C) Fold change in cell spreading area between shLuc- and shDST-expressing MCF10A cells. Data are from three biological replicates performed in triplicates. A total of 1099 and 948 shLuc- and shDST-expressing cells, respectively, were quantified (D) Percentage (%) of shLuc- or shDST-expressing MCF10A cells adhering to the substratum. Data are from three biological replicates performed in triplicates. (E) (Upper panels) Western blots on protein extracts from shLuc- or shDST-expressing MCF10A cells, blotted with anti-Zyxin (upper bands) or anti-GAPDH (lower bands). (Lower panels) Ratio of Zyxin levels between shLuc- and shDST-expressing MCF10A cells, normalized to GAPDH. Data are three four biological replicates. (F) Fold change in Zyxin mRNA levels between shLuc- and shDST-expressing MCF10A cells. Data are from three biological replicates, performed in triplicate. For all quantifications, error bars indicate SD.; *indicates P < 0.05; ***indicates P < 0.001.

