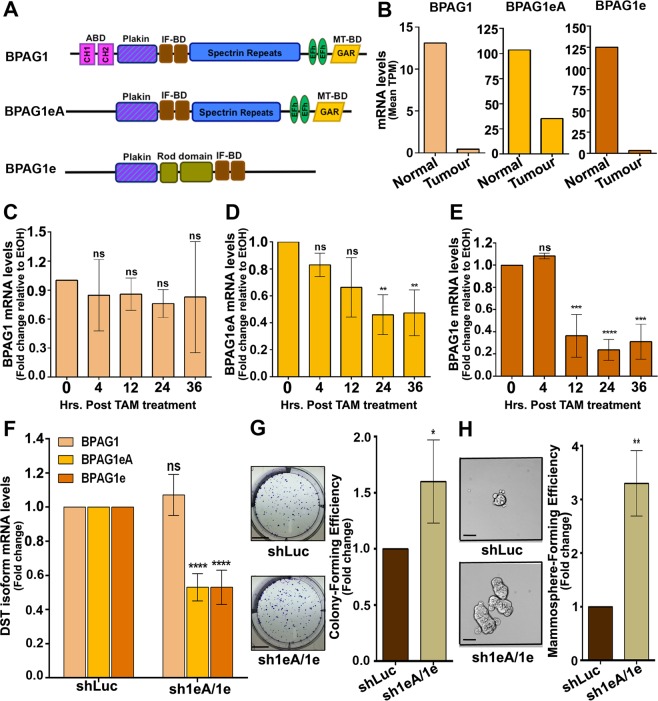
Figure 7.
BPAG1eA and BPAG1e are downregulated by Src activation and in breast tumours and promote transformation of MCF10A cells when knocked down. (A) Schematic domain representation of the human BPAG1 long isoforms and the two shorter BPAG1eA and BPAG1e isoforms. (B) Median number of Transcripts Per Million (Median TPM) for BPAG1, BPAG1eA and BPAG1e in 114 normal breast tissues or 1097 breast tumour samples. (C–E) Ratio of BPAG1 (C) or BPAG1eA (D) or BPAG1e (E) mRNA levels between TAM- and EtOH-treated MCF10A-ER-Src cells for the same time points (0, 4, 12, 24 and 36 hours), normalized to GAPDH. Data are from three biological replicates, performed in triplicates. (F) Fold change of BPAG1 or BPAG1eA or BPAG1e mRNA levels between shLuc- and shBPAG1eA/1e-expressing MCF10A cells, normalized to GAPDH. Data are from three biological replicates performed in triplicates. (G) (Left panels) Representative images of colonies from shLuc- or shBPAG1eA/1e-expressing MCF10A cells grown in clonogenic assays. Scale bars represent 5 mm. (Right panel) Fold change in colony-forming efficiency between shLuc- and shBPAG1eA/1e-expressing MCF10A cells. Data are from three biological replicates performed in triplicates. (H) (Left panels) Representative images of shLuc- or shBPAG1eA/1e-expressing MCF10A mammospheres. Scale bars represent 50 μm. (Right panel) Fold change in mammosphere-forming efficiency between shLuc- and shBPAG1eA/1e-expressing MCF10A cells. Data are from three biological replicates performed in triplicates. For all quantifications, error bars indicate SD.; ns indicates non-significant; *indicates P < 0.05; **indicates P < 0.005; ***indicates P < 0.001; ****indicates P < 0.0001.

