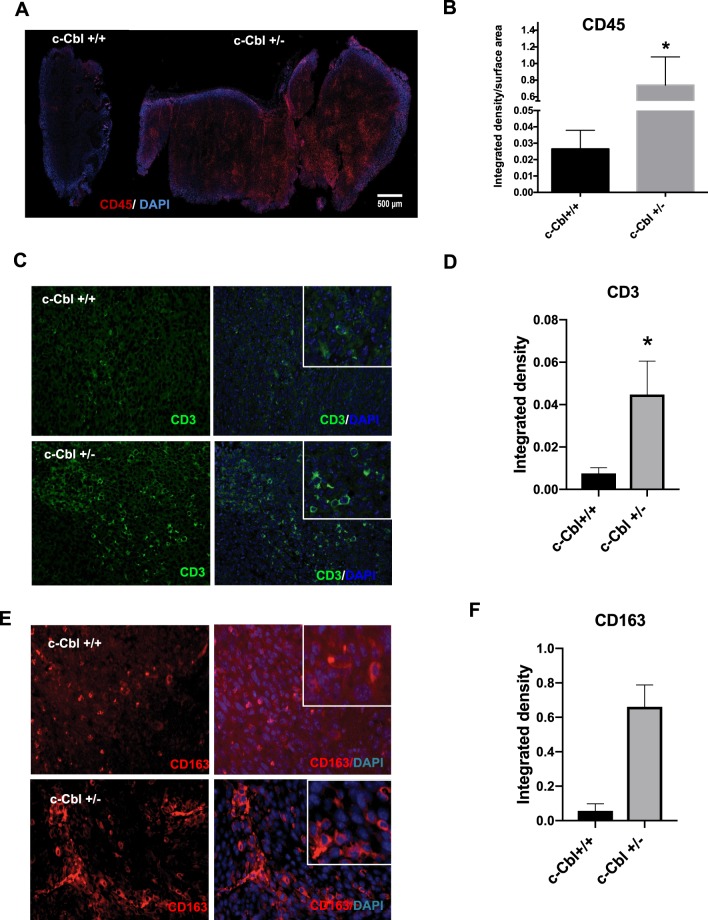
Figure 2.
Increased immune infiltrate in xenografts of c-Cbl+/− mice. (A) Xenografts were stained for CD45+ cells and DAPI for the nuclei. Intense DAPI stain at the periphery of the tumor is due to increase staining at the edges (edge effect). Representative Images from six xenografts per group. (B) CD45+ cell infiltration was quantitated as integrated density and normalized for the area of the tumor in square micron. Average of four sections of the tumor per mouse is shown. Total of six tumors per group. Student’s t-test was performed. Error bars = SEM. p = 0.043. (C) Xenograft from each mouse was stained for CD3+ cells. The insert shows tumor-associated lymphocytes. DAPI stained nuclei. Representative images from six xenografts per group are shown. (D) CD3+ cell infiltration was quantitated as integrated density. Average of ten sections of the tumor per mouse is shown. Total of six tumors per group. Student’s t-test was performed. Error bars = SEM. p = 0.03. (E) Xenograft from each mouse was stained for CD163+ cells. The insert shows the tumor-associated macrophages. Representative images from six xenografts per group are shown. (F) CD163+ cell infiltration was quantitated as integrated density. Average of ten sections of the tumor per mouse is shown. Total of six tumors per group. Student’s t-test was performed. Error bars = SEM. P < 0.001.

