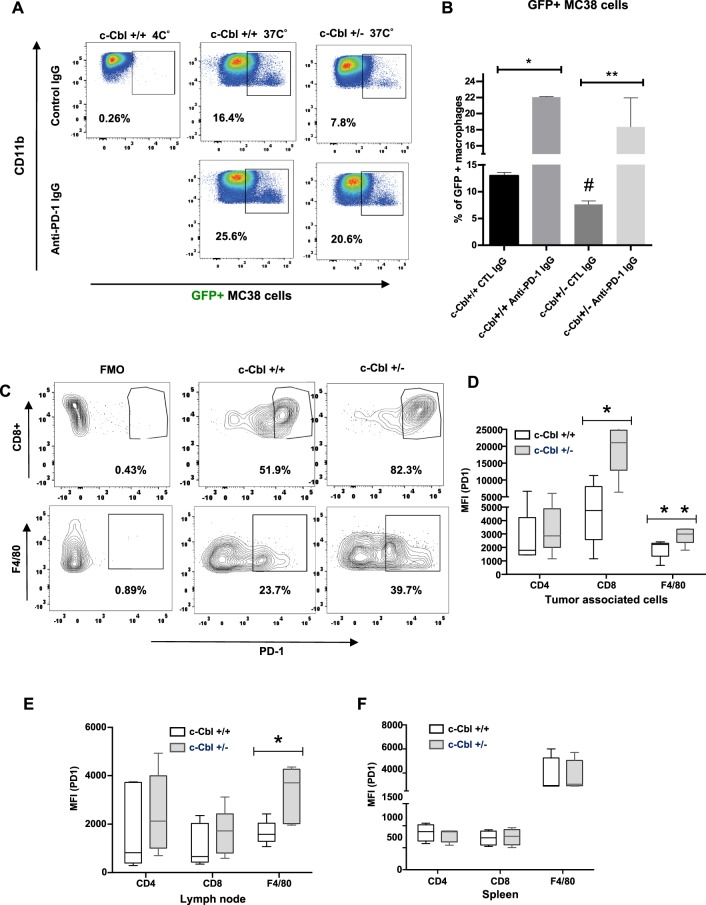
Figure 3.
Reduced c-Cbl activity compromises tumor phagocytosis while increasing PD-1 expression in macrophages. (A) BMDM differentiated from c-Cbl+/+ and c-Cbl+/− for 7 days were co-cultured with GFP+ MC38 tumor cells for 4 hours and treated with iso-type control or anti-PD-1 neutralizing antibodies. Representative FACS from three independent experiments is shown. Gate set with GFP and Fluorescence Minus One (FMO) served as control. (B) Averages from three independent experiments with MC38 cells are shown. 2-way ANOVA and Student’s t-test were performed. Error bars = SEM. #p = 0.013 compares c-Cbl+/+ and c-Cbl+/− macrophages treated with the control antibody, *p = 0.002, **p = 0.05. (C) MC38 xenografts were harvested and the tumor-associated immune cells were sorted for live and dead cells using Zombie dye followed by cell-type specific markers such as CD8 for cytotoxic T-lymphocytes and F4/80 for activated macrophages. The Fluorescence Minus One Control or FMO served as control. Representative FACS plots from six independent tumors are shown. Gates set with PD-1 Fluorescence Minus One (FMO) control. (D) Mean fluorescence intensity (MFI) of PD-1 on tumor-associated immune cells from six mice in each group is shown as box plots. The borders of the box depict 25th and 75th percentile and whisker corresponding to minimum and maximum values. Student’s t-test were performed. *p = 0.007, **p = 0.050. (E) MFI of PD-1 on cells from lymph nodes of tumor-injected six mice in each group is shown. Student’s t-test were performed. * p = 0.002. (F) MFI of PD-1 from splenic cells from un-injected mice six mice per group. Error bars = SEM.

