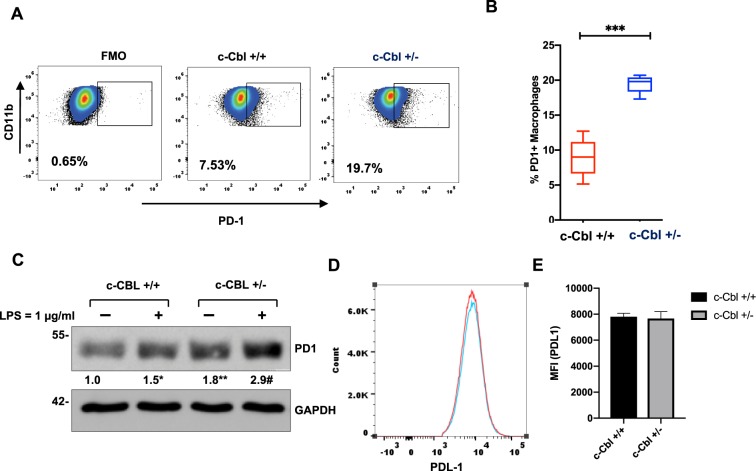
Figure 4.
Bone marrow derived c-Cbl+/− macrophages express higher levels of PD-1. (A) BMDM differentiated from c-Cbl+/+ and c-Cbl+/− for 7 days were subjected to FACS analysis. The cells were gated using CD11b and PD-1. Percentage of PD-1+ macrophages are shown. Fluorescence minus one (FMO) served as a control. Representative FACS plots from three independent experiments are shown. (B) Average from three independent experiments is shown. Student’s t-test were performed. Error bars = SEM. *p < 0.001. (C) Lysates of BMDMs from mice differentiated for 7 days and treated with LPS overnight. Representative immunoblots from three independent experiments. Student’s t-test with Bonferroni correction was performed. *p = 0.004 for PD-1 in c-Cbl+/+ macrophages with and without LPS, **p = 0.001 for PD-1 between c-Cbl+/+ and c-Cbl+/− macrophages without LPS and #p = 0.02 for LPS-treated c-Cbl+/+ and c-Cbl+/− macrophages. Here, and in all other blots, molecular weights in kilo Dalton are denoted on the left. (D) BMDM from c-Cbl+/+ (red line) and c-Cbl+/− (blue line) mice differentiated for 7 days and treated with LPS overnight were examined using FACS for PDL-1. Representative MFI of PDL-1 from three independent pairs of mice is shown. (E) Average MFI of PDL-1 on BMDM obtained from both the groups (N = 3 mice/group) is shown. Student’s t-test were performed. Error bars = SEM. p = 0.3.

