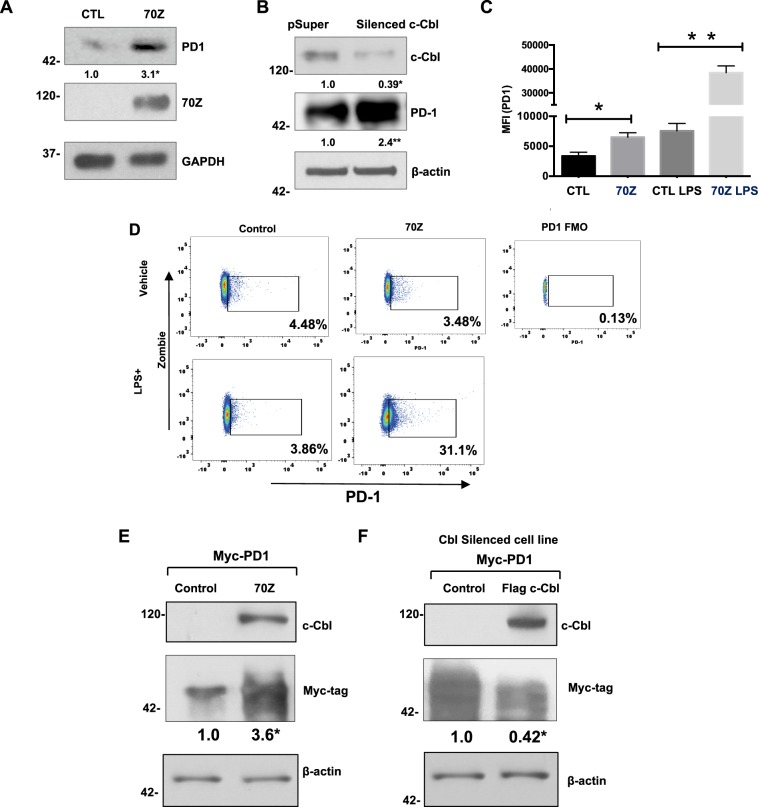
Figure 6.
c-Cbl suppresses PD-1. (A) RAW264.7 cells transfected with Myc-tagged 70Z-c-Cbl and control (CTL) plasmids were probed separately. Representative immunoblots of five experiments are shown. Student’s t-test was performed. *p = 0.003. (B) RAW267.4 cells expressing control (pSuper) or c-Cbl shRNA (silenced c-Cbl) were probed. Equal amounts of lysates were probed separately for PD-1. Representative immunoblots from three independent experiments. Student’s t-test was performed. * and **p = 0.001. (C) RAW267.4 cells transfected with 70Z-c-Cbl and control plasmids were treated for 16 hours with LPS (1 ug/ml) followed by FACS analysis. The live cells using Zombie were gated for PD-1. MFI of PD-1+ cells from three independent experiments is shown. ANOVA and Student’s t-test were performed. Error bars = SD. *p = 0.03 and **p = 0.001. (D) RAW267.4 expressing 70Z-c-Cbl and control plasmids were treated overnight with or without LPS (1 ug/ml) for 16 hours followed by FACS analysis. The cells were gated using Zombie dye and for PD-1. Gates set with PD-1 Fluorescence Minus One (FMO) control. Representative FACS plots from three independent experiments are shown. (E) HEK 293 T cells co-expressing Myc-tagged PD-1 and different c-Cbl constructs were lyzed and probed for c-Cbl and actin. Equal amounts of lysates were probed for Myc-tagged PD-1 given close proximity to Actin. A representative of three experiments is shown. Increase in PD-1 was compared using Student’s t-test. *p = 0.01. (F) HEK2913T cells silenced for c-Cbl were transfected with Myc-PD-1 and c-Cbl or control vector. The lysates were probed for c-Cbl and Actin. Equal amounts of lysates were probed for Myc-tagged PD-1 given close proximity to Actin. A representative of three experiments is shown. Suppression in PD-1 expression was compared using Student’s t-test. *p = 0.02.

