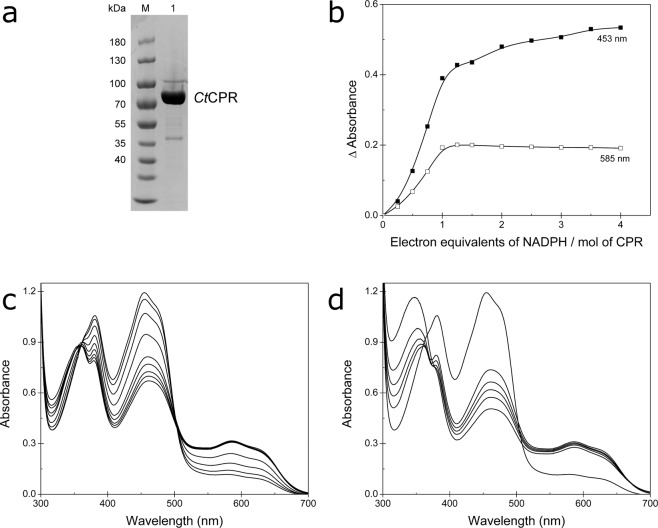
Figure 1.
(a) SDS-PAGE of purified CtCPR (lane M: molecular weight marker, lane 1: CtCPR after three-step purification). (b) Changes in absorbance at 453 nm and 585 nm peaks after addition of different equivalents of the cofactor. (c) Spectral properties of CtCPR. Changes in absorbance were recorded after the addition of NADPH (up to four equivalents per mol of CPR). (d) Spectral change after addition of excess NADPH (more than four electron equivalents per mol of CPR).

