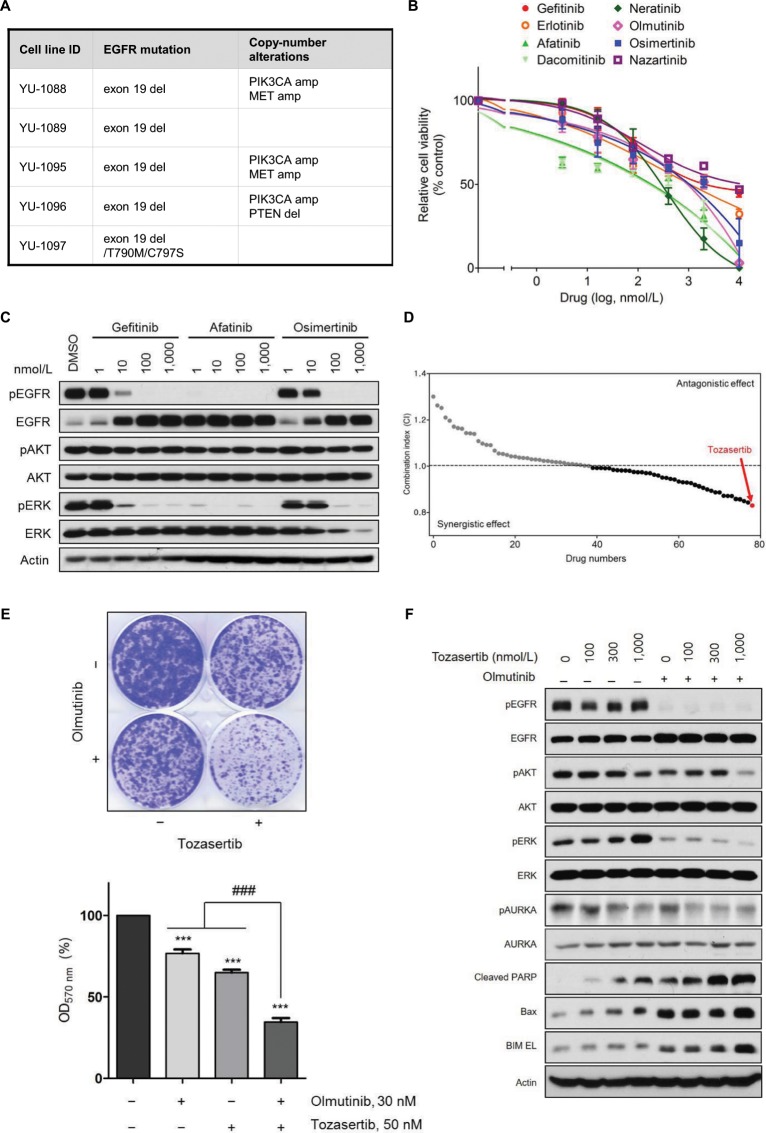
Figure 4.
Aurora kinase A as a potential therapeutic target in EGFR-mutant NSCLC resistant to olmutinib. (A) Summary of WES analysis in PDCs resistant to third-generation EGFR-TKIs. Known mechanisms of resistance to osimertinib are shown. (B) Inhibition of YU-1089 cells by gefitinib (IC50 = 2,162 nmol/L), erlotinib (IC50 = 1,231 nmol/L), afatinib (IC50 = 275 nmol/L), dacomitinib (IC50 = 244 nmol/L), neratinib (IC50 = 275 nmol/L), olmutinib (IC50 = 857 nmol/L), osimertinib (IC50 = 1,013 nmol/L), and nazartinib (IC50 = 3,908 nmol/L). Cell viability was measured by CellTiter-Glo. Data are presented as the mean ± SEM (n = 3). (C) YU-1089 cells were treated with the indicated concentrations of gefitinib, afatinib, or osimertinib for 6 hours. Cell lysates were immunoblotted with the indicated antibodies. Immunoblots are representative of 3 independent experiments. (D) Combinatorial drug screening with 1 μM of olmutinib and 1 μM of each kinase inhibitor from the drug library was performed on YU-1089 cells to identify potent drug combinations. The x axis represents a number of kinase inhibitors used in this screen. The y axis represents combination index (CI) determined by the Bliss independence model. Each dot is the resulting CI for the individual drug. Gray dots indicate drugs with antagonism (CI > 1), whereas black dots indicate drugs with synergism (CI < 1). Tozasertib (red) exhibited the strongest synergistic effect. The screening identified 41 drugs with synergistic effects (CI < 1). (E) YU-1089 cells were treated with olmutinib alone, tozasertib alone, or a combination of olmutinib with tozasertib for 2 weeks. Colony formation was stained by crystal violet (upper panel). The bar graph (lower panel) shows quantification of the crystal violet staining. (ANOVA with Dunnett’s post test: ***p < 0.001 vs the value in negative control, ###p < 0.001 vs the value at the indicated comparison, n = 3). (F) YU-1089 cells were treated with the indicated concentrations of tozasertib or in combination with olmutinib for 24 hours. Cell lysates were immunoblotted with the indicated antibodies. Immunoblots are representative of 3 independent experiments. The full-length blots can be found in Supplementary Fig. 8.

