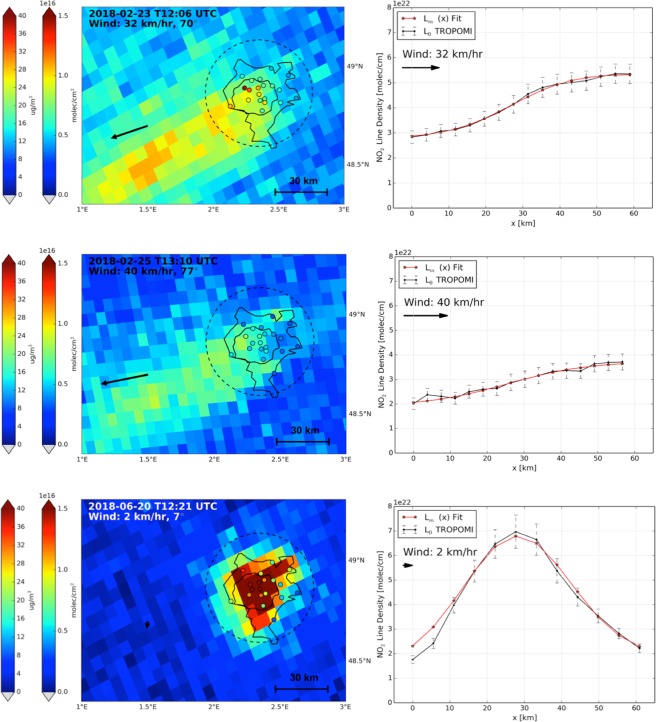
Figure 3.
(a) Tropospheric NO2 columns over Paris on Friday 23 February 2018, (c) Sunday 25 February 2018, and (e) Wednesday 20 June 2018 observed by TROPOMI. Boundary layer mean wind speed and wind direction, indicated by the black arrow, are from ECMWF ERA-Interim data. The open circles represent the NO2 surface concentration in μg m−3 measured at urban background stations within 30 minutes of the TROPOMI overpass time (leftmost colour bar). The Paris A86 ring road is indicated by the inner black line, and the city limits are approximated by the outer black line. The right panels (b,d,f) show the corresponding NO2 line densities between the upwind and downwind city limits at 0 and 60 km, with line densities calculated by integrating over 60 km perpendicular to the wind (see Methods and Fig. S2).

