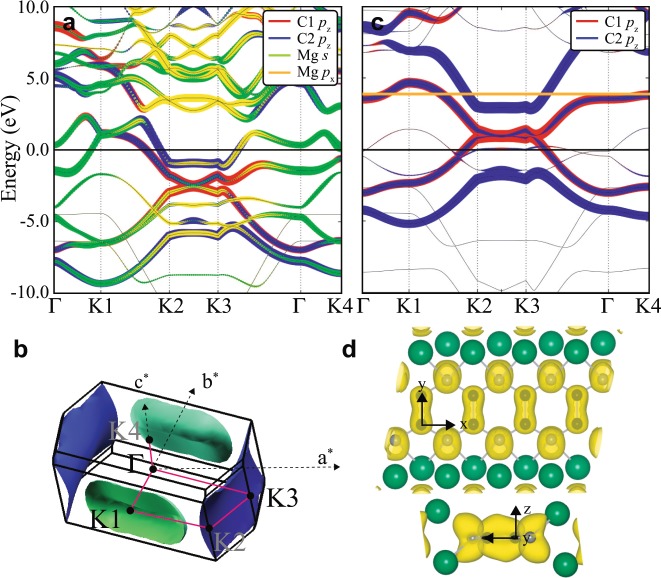
Figure 4.
Electronic structure calculations at ambient pressure. Fat band structures for (a) MgGNR and (b) the hypothetical structure (HS). The orange line denotes the energy shift with respect to MgGNR. (c) The Fermi surface of MgGNR. The red line indicates the k-path of the band structure. (d) The charge density plot of MgGNR. The upper and lower ones are the top view and side view, respectively. x, y, and z represent the local axes. The charge density is integrated over −2 eV to EF with an isosurface level of 0.047 e/Å3.

