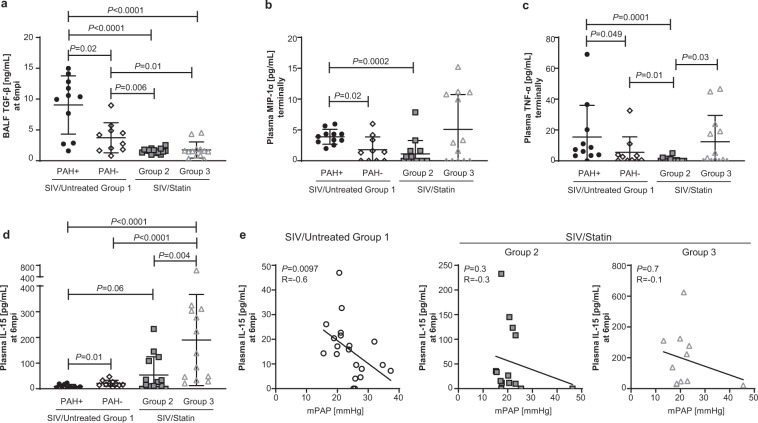
Figure 3.
Effect of statins on SIV-PAH-associated cytokine profiles. (a) Bronchoalveolar lavage fluid (BALF) TGF-β levels at 6mpi. (b,c) Terminal plasma levels of MIP-1α and TNF-α, respectively. (d) Plasma IL-15 levels at 6mpi. (a–d) Mann-Whitney U test was used for statistical analysis. Data represents the mean ± SD. (e) Spearman correlation analysis between mPAP and plasma IL-15 at 6mpi in SIV/Untreated animals (left), and statin-treated cohorts (center, right); R, Spearman coefficient.

