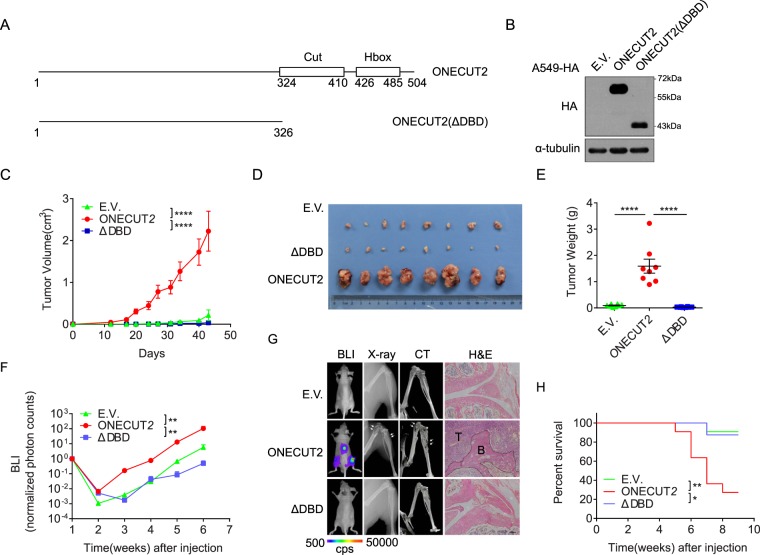
Figure 3.
ONECUT2 promotes the xenograft tumorigenesis and bone metastasis of A549 cells in vivo. (A) Schematic view of ONECUT2 and its ΔDBD mutant. Cut domain and Homeobox domain along with their position are shown. (B) Western Blot of whole cell lysates from A549-ONECUT2, A549-E.V. and A549-ONECUT2(ΔDBD) cells using antibodies against HA and α-tubulin. The full-length blot is presented in Supplementary Fig. 5. (C) Quantification of xenograft tumor volume. Error bars indicate mean ± SD (****p < 0.0001, t-test). (D) Image of isolated tumor masses. (E) Scatter dot plot of tumor weight at endpoint. Mean of each group are shown (****p < 0.0001, t-test). (F) Quantification of bioluminescence imaging (BLI) of bone metastasis burden (*p < 0.01, ns: not significant, t-test). (G) In vivo analysis of bone metastasis. Shown are representative mice at 4 weeks after cancer cell implantation; BLI, X-ray, micro-CT and hematoxylin and eosin (H/E) staining of animal hind limbs 6 weeks after cancer cell implantation. Areas circled by dotted lines denote tumor regions, and arrows indicate the regions of bone damage. (H) Overall survival curves of mice injected with different cell lines (*p < 0.01, **p < 0.001, log rank test).

