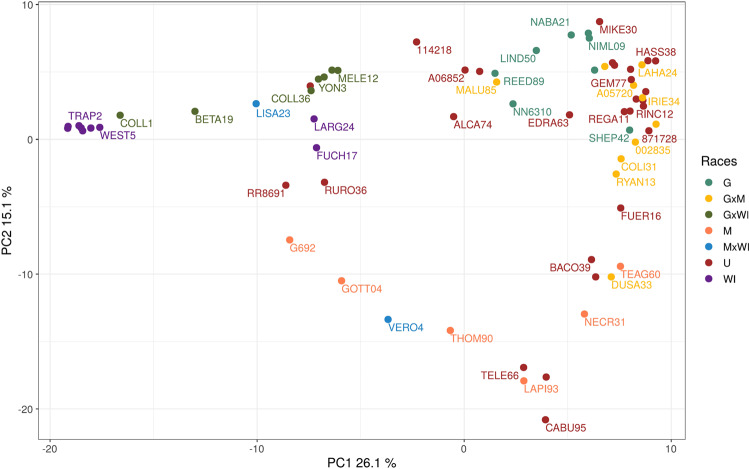
Figure 1.
Principal component analysis (PCA) of 71 avocado accessions with 7108 SNPs using the R software version 3.5.1 with the package ggplot2 version 374. Each genotype is represented with its sampleID (Table 2). The colors explain the race of the accessions according to the literature: turquoise green: G, yellow: GxM, dark green: GxWI, orange: M, red: U, orange: M, blue: MxWI, and purple: WI. (G: Guatemalan, M: Mexican, WI: West Indian and U: Unknown).

