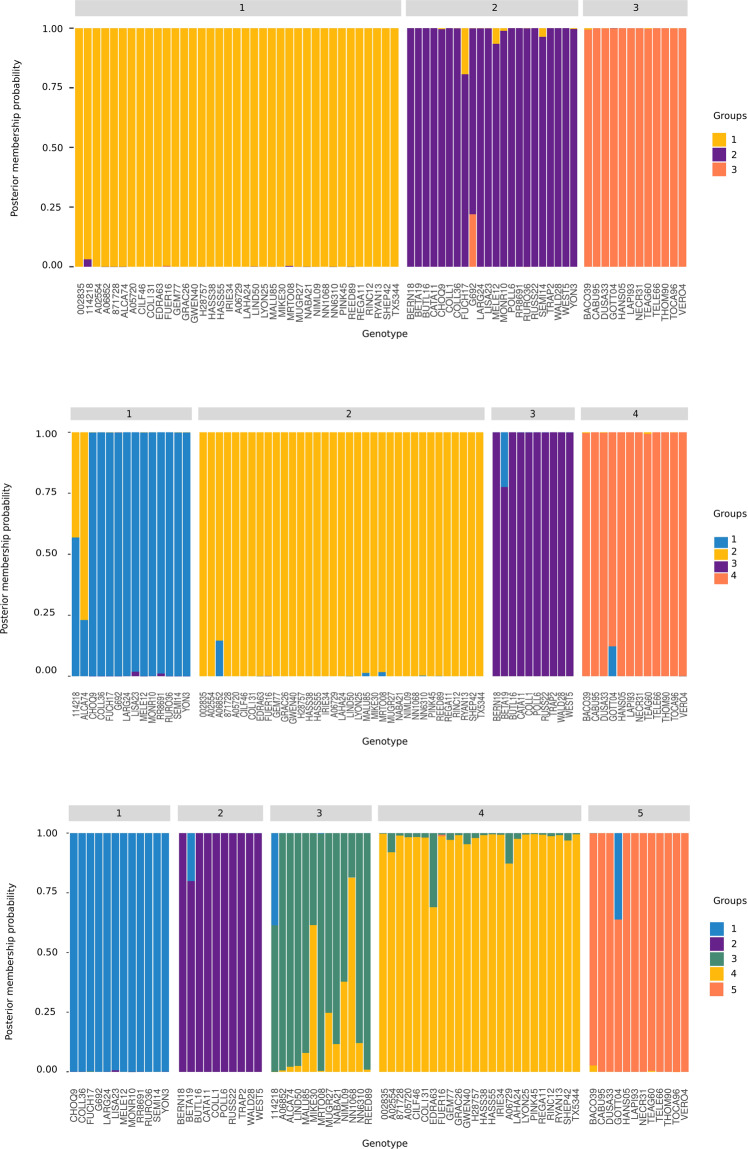
Figure 3.
Discriminant analysis of principal components (DAPC) to infer group structure for the number of groups K = 3–5 (obtained with the function find.clusters.) (Table S3) and produced using the R software version 3.5.1. Each genotype is a bin on the x-axis, and the assigned probability of population membership is shown as a stacked bar chart. Each population is shown in different color. Overall for K = 3, group 1: GxM, group 2: WI, group 3: M; for K = 4, group 1: GxWI and MxWI, group 2: GxM, group 3: WI, group 4: M; for K = 5, group 1: GxWI and MxWI, group 2: WI, group 3: G, group 4: GxM, group 5: M.

