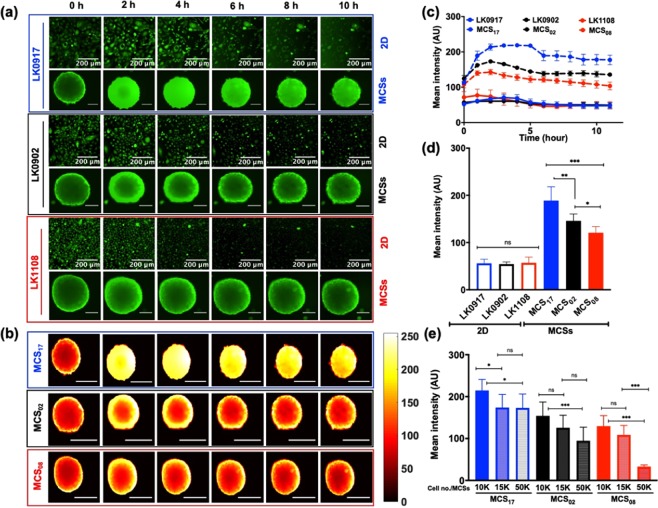
Figure 4.
Real-time monitoring of calcein-AM uptake in 2D and MCSs. (a) Elucidate calcein-AM uptake in 2D cell cultures and MCSs obtained from LK0917- MCS17 (upper panel), LK0902- MCS02 (middle panel), and LK1108- MCS08 (lower panel) and over a time span of 10 hours with image acquisition at 20-minute intervals (scale bar, 200 μm). (b) Heat map pseudo color images of MCSs for differential calcein-AM uptake for the three cell lines (scale bar, 200 μm, scale bar on the right represents the pixel intensity of green fluorescence). (c) Mean fluorescence intensity profile with respect to time (12 hours) in the 2D cell cultures (LK0917, LK0902, and LK1108) and MCSs (MCS17, MCS02, and MCS08) respectively. (d) Total accumulated calcein over time (12 hours) in 2D and MCSs for all three cell lines. (e) Total accumulated calcein profiles of MCSs obtained from different cell densities. The data are shown as mean ± SD; ***p < 0.001, **p < 0.05, *p = 0.019, and ns = non-significant (n = 3).

