Figure 6.
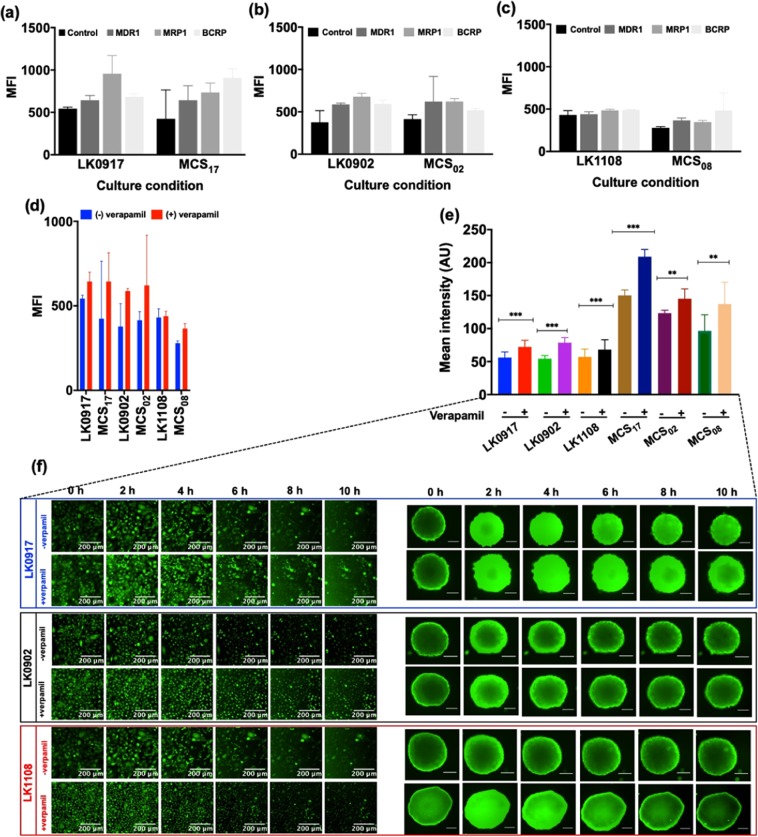
(a–c) Median fluorescence intensity (MFI) values for 2D and MCSs cultures of LK0917, LK0902, and LK1108 in presence of different ABC pump inhibitors for MDR1, MRP1, and BCRP. (d) MFI for MDR1 pump inhibitor (verapamil) and its corresponding live cell imaging for 2D and MCSs cultures. (e) Total calcein-AM uptake for the entire course of 10 hours +/− verapamil for 2D and MCSs. The data are shown as a mean of ± SD, ***p < 0.001, **p < 0.05. (f) Elucidate calcein-AM uptake in 2D for LK0917, LK0902 and LK1108 in presence and absence of verapamil over a time span of 10 hours with images taken after every 20 minutes (images shown here are at 2 h interval). Scale bar 200 μm.

