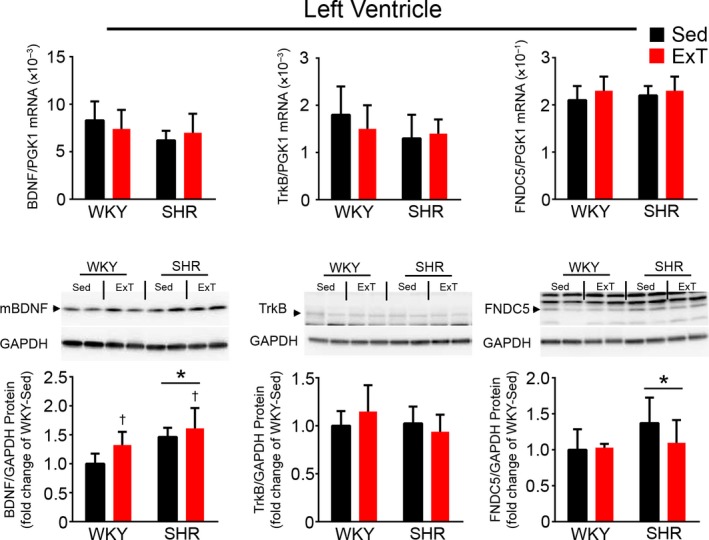
Figure 1.

BDNF, TrkB, and FNDC5 mRNA, and protein expression in the LV of SHR and WKY with or without 5 weeks of exercise training. Upper panel shows summary data of mRNA in the LV. Lower panel represents representative western blot images and summary data of protein in bar graphs. Values of different proteins in the WKY‐Sed were normalized to 1. Values are mean ± SD (n = 7–10/group). For LV BDNF mRNA: SHR versus WKY, F = 3.85, p = .06 NS; ExT versus Sed, F = .003, p = .95 NS; ExT × strain interaction, F = 1.69, p = .21 NS. For LV BDNF protein: SHR versus WKY, F = 16.85, p = .0004; ExT versus Sed, F = 6.68, p = .016; ExT × strain interaction, F = .92, p = .35 NS. For LV TrkB mRNA: SHR versus WKY, F = 3.13, p = .09 NS; ExT versus Sed, F = .31, p = .85 NS; ExT × strain interaction, F = 1.76, p = .20 NS. For LV TrkB protein: SHR versus WKY, F = 1.62, p = .22 NS; ExT versus Sed, F = .18, p = .68 NS; ExT × strain interaction, F = 2.62, p = .12 NS. For LV FNDC5 mRNA: SHR versus WKY, F = .83, p = .37 NS; ExT versus Sed, F = 1.92, p = .18 NS; ExT × strain interaction, F = .26, p = .61 NS. For LV FNDC5 protein: SHR versus WKY, F = 4.69, p = .04; ExT versus Sed, F = 1.44, p = .24 NS; ExT × strain interaction, F = 2.25, p = .15 NS. *p < .05 versus WKY. † p < .05 versus Sed
