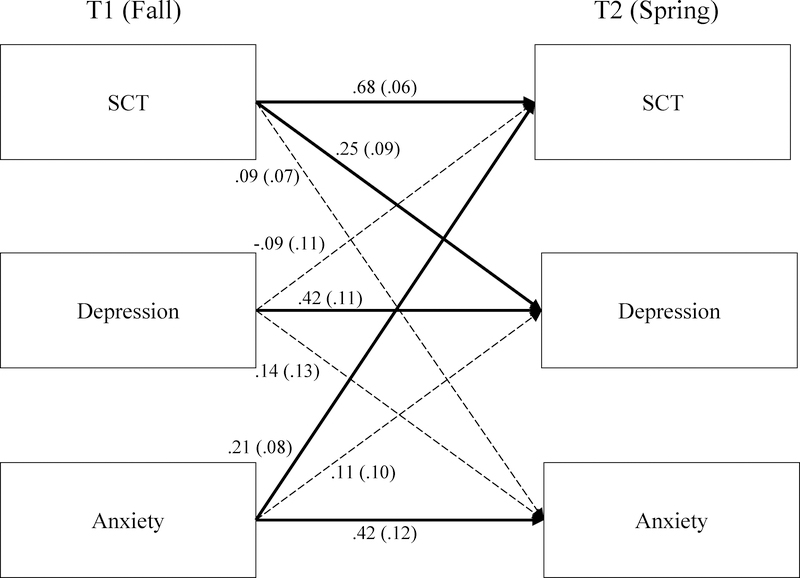
Figure 2.
Cross-lag model for SCT and child-rated internalizing symptoms.
Note. SCT = Sluggish cognitive tempo. T1 = fall timepoint. T2 = spring timepoint (approximately 6 months after T1). Statistically significant standardized path coefficients (and standard errors) are shown with solid lines and dotted lines represent a non-significant path (p > .05). Covariates and cross-sectional correlations were included in the model but are omitted from the figure to reduce complexity. χ2(9) = 15.57, p = .08. RMSEA = .07. CFI = .979.

