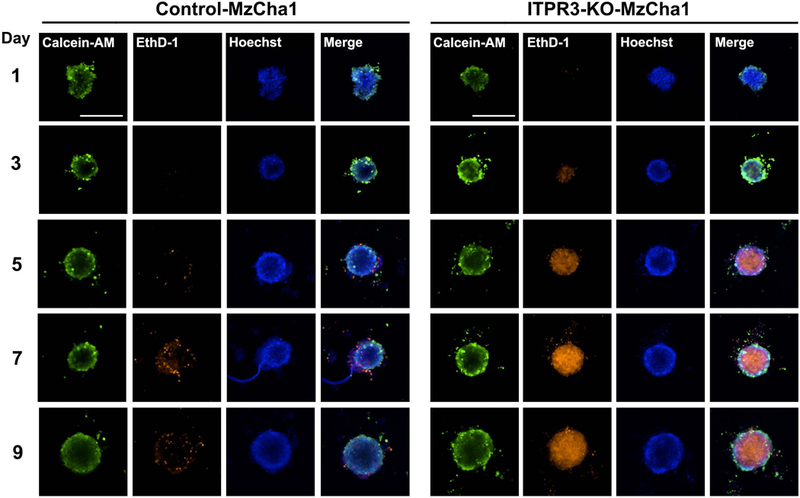
Figure 7. Loss of ITPR3 results in increased death of MzCha1 cells in a 3D-spheroid model.

Representative fluorescence images of spheroids cultured from control (left panel) and ITPR3-KO (right panel) MzCha1 cells. Spheroids were co-labeled with calcein acetoxymethyl ester (calcein-AM) and ethidium homodimer-1 (EthD-1) to detect changes in growth and viability of the spheroids over 9 days. Composite images of representative spheroids stained with calcein-AM (green) for live cells, EthD-1 (orange) for dead cells, and Hoechst (blue) for nuclei, are shown. Scale bar: 500 μm. (n= 3 spheroids from 6 separate preparations for each time point and for each cell type, for a total of 180 spheroids that were examined).
