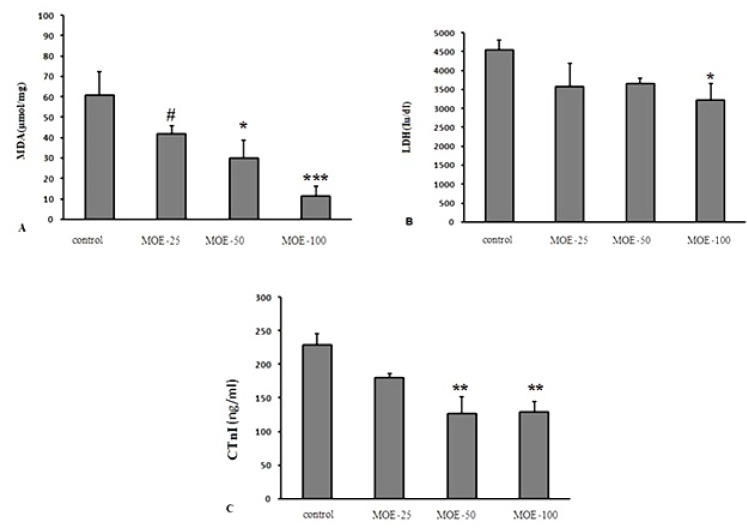
Figure 5.
Effect of various treatments on serum levels of MDA (A), LDH (B) and CtnI (C) at 5 days after reperfusion in different groups. The values are expressed as mean±SEM; cTnI = Cardiac troponin I; LDH = lactate dehydrogenase; MDA = malondialdehyde. Data are presented as mean ± SEM. * Significant difference compared to the control group (p < 0.05); ** Significant difference compared to the control group (p < 0.01); *** Significant difference compared to the control group (p < 0.001); # Significant difference compared to the 100 mg/kg M. officinalis extract-treated group (p < 0.05)

