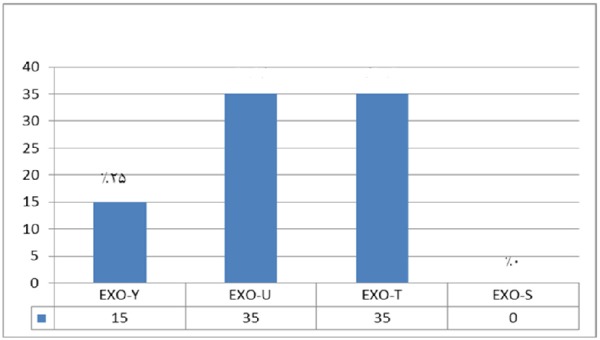
Figure 9.

The frequency of exoenzymes Y, U, T and S are shown in Graph 1. Exoenzymes T and U had the highest frequency of 68.8% among all studied samples taken from animal isolated strains

The frequency of exoenzymes Y, U, T and S are shown in Graph 1. Exoenzymes T and U had the highest frequency of 68.8% among all studied samples taken from animal isolated strains