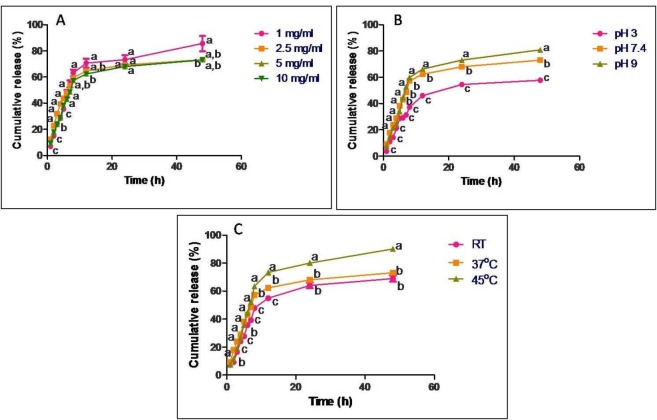
Figure 3.
In-vitro release profile of GTP from casein nanoparticles at regular time intervals ranging from 1 h to 48 h under constant shaking conditions expressed as cumulative release percentage. Release studies were carried out with different concentrations of (A) GTP, (B) different pH and (C) different temperatures. Data are presented as means of three replicates. Means followed by same latter at each time interval are not significantly different at p ≤ 0.05 according to DMRT

