
Figure 6.
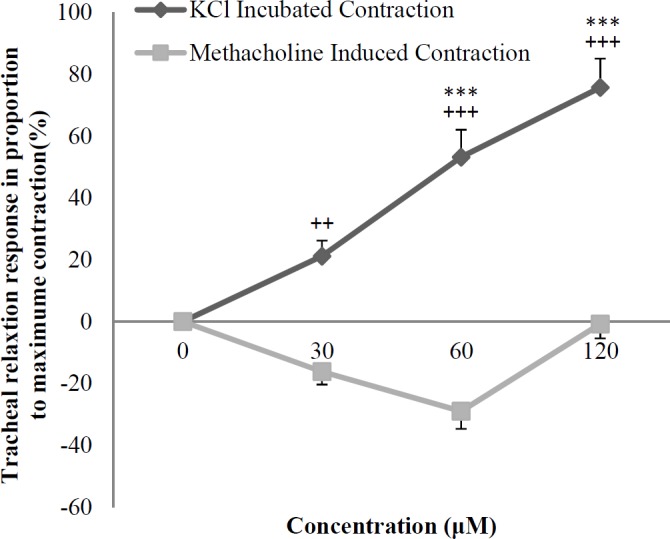
Concentration-response relaxant effect (mean ± SEM) of crocin on methacholine (10 μM) and KCl (60 mM) induced contraction of non-incubated tracheal smooth muscle (n = 8). ***p < 0.001 compared to saline (as indicated by zero in X axis of the figure). ++p < 0.01, +++p < 0.001, compared to the relaxant effect on methacholine induced muscle contraction. Statistical comparison of the effect of each concentration between two groups was performed using unpaired t-test