Figure 8.
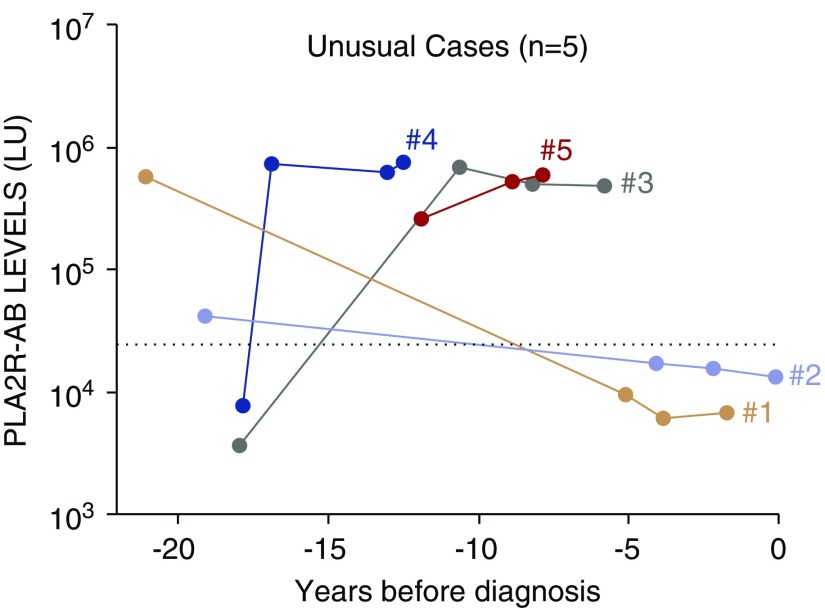
PLA2R-AB is elevated years to decades before MN diagnosis in a minority of cases. Five unusual cases with detectable seropositive PLA2R-AB over 10 years before diagnosis of MN. The longitudinal PLA2R-AB profile is shown for the unusual MN cases. The cut-off value for determining PLA2R-AB seropositivity is shown by the dotted line and time zero represents biopsy-proven diagnosis of MN. Cases 1–5 are shown by the orange, magenta, green, blue, and red lines, respectively.

