Figure 3.
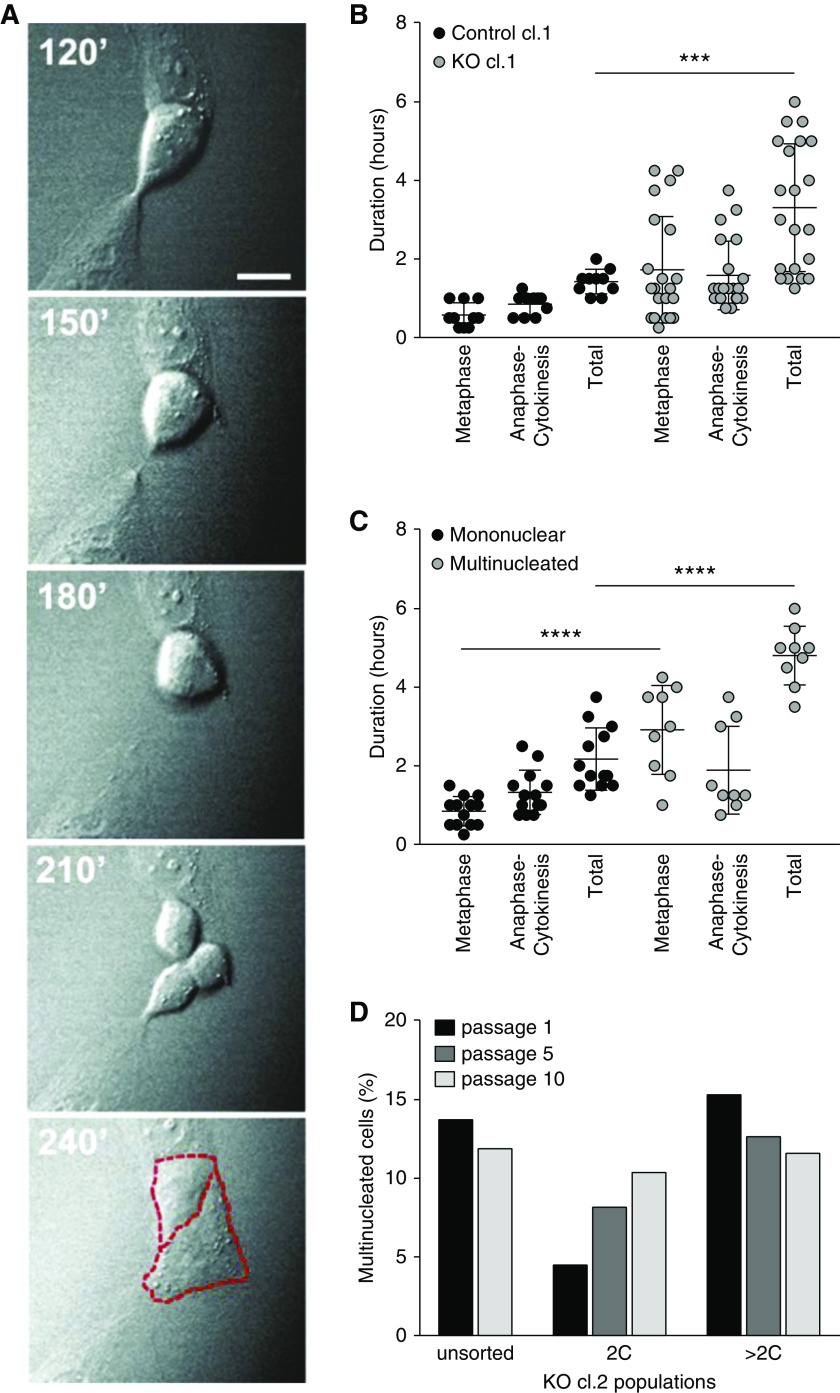
Multinucleated CRISPR/Cas9 OCRL KO cells result from prolonged cell cycle transit. (A) DIC imaging time course showing a tripolar division that resolves into two cells (borders highlighted in red, dashed lines) Scale bar, 25 µm. (B) CRISPR/Cas9 control clone 1 (cl.1) and KO cl.1 cells were imaged live every 15 minutes for 5.75–11.25 hours to capture cell divisions in randomly selected fields. The plot shows the durations of the metaphase and anaphase-cytokinesis stages of mitosis, and the total time spent in metaphase-cytokinesis measured in individual cells that underwent mitosis during the imaging period (control cl.1, 10 cells and KO cl.1, 23 cells). (C) Data from KO cl.1 cells in (B) were segregated on the basis of the outcome of mitosis (13 mononuclear versus nine multinucleated cells), and the durations of metaphase, anaphase-cytokinesis, and the total time spent in metaphase-cytokinesis for each are plotted. ***P<0.001 and ****P<0.001 on the basis of two-way ANOVA Holm–Sidak multiple comparisons test. (D) CRISPR KO clone 2 (cl.2) cells were sorted by FACS on the basis of nuclear content. Mononuclear (2C) and multinucleated (>2C) cells were isolated and cultured separately for ten passages. The percentage of cells with multiple nuclei was assessed at passages 1, 5, and 10 by fluorescence staining. cl, clone.

