Figure 2.
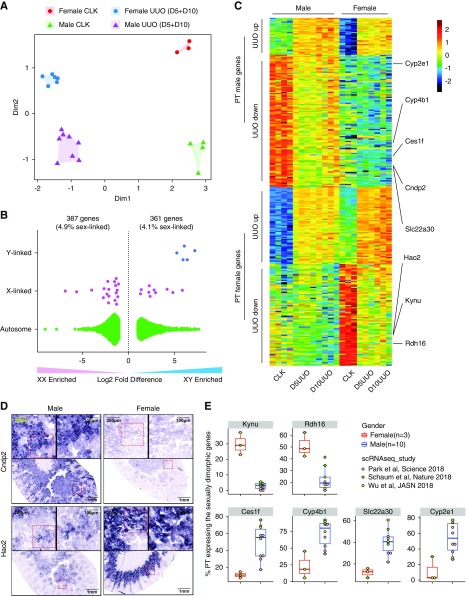
TRAP reveals sexually dimorphic gene expression in PT. (A) MDS plot shows separation of the PT TRAP samples by disease and sex. (B) Chromosomal distribution of sexually dimorphic genes (FDR<0.05, log fold change >1 or less than −1). (C) Heatmap visualizing the sex-specific genes that are differentially expressed in UUO kidney. (D) Sex-specific expression pattern of Cndp2 and Hao2 validated by RNA ISH. Red boxes indicate region enlarged. (E) Reanalysis of published scRNA-seq data sets confirms the specific expression of Kynu and Rdh16 in female PT, and Ces1f, Cyp4b1, Slc22a30, and Cyp2e1 in male PT. Statistical analysis was performed using the Welch t test to compare data between sexes. D5, day 5; D10, day 10.

