Fig. 3.

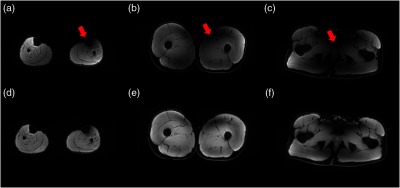
Comparison of the muscle images (a)–(c) without and (d)–(f) with improved N3 bias correction. The bias field due to B1 inhomogeneity indicated by the red arrows is largely corrected with the proposed method.

Comparison of the muscle images (a)–(c) without and (d)–(f) with improved N3 bias correction. The bias field due to B1 inhomogeneity indicated by the red arrows is largely corrected with the proposed method.