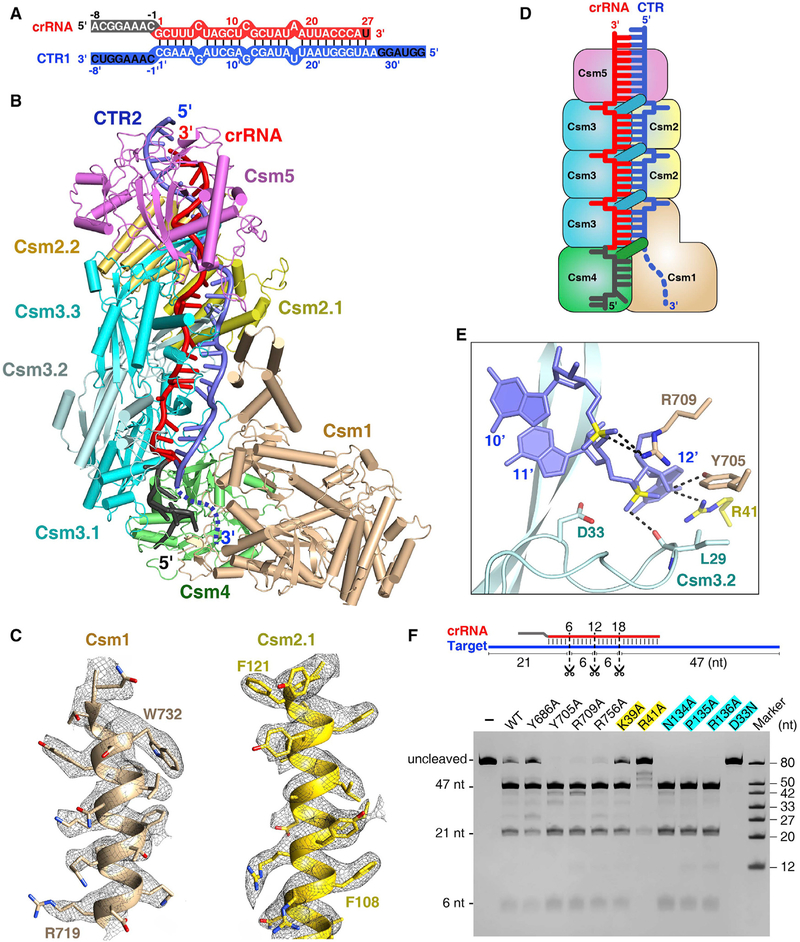
Figure 3. Cryo-EM Structure of the Csm-CTR Complex Either in the Absence or Presence of DNA.
(A) Schematic representation of the crRNA-CTR1 duplex. The color codes of crRNA and target RNA are identical to those used in Figure 2A.
(B) Overall structure of Csm1 H15A and Csm3 D33N catalytic mutant Csm in complex with CTR2 in the presence of bubble dsDNA at 3.05 Å resolution. The disordered the 3′ anti-tag of CTR2 is shown by a blue dashed line.
(C) Cryo-EM maps and fits for selected regions of Csm1 (residues 719–734) and Csm2.1 (residues 106–122) in the 3.05 Å CTR-bound Csm complex.
(D) Schematic representation of the Csm-CTR complex. Color-coding is identical to that used in Figure 1B.
(E) Close-up view of the scissile phosphate and the conserved catalytic residue Csm3 Asp33. The Csm3 D33N mutant was used for structural studies.
(F) Target RNA cleavage assay. Three scissors indicate the cleavage sites. The Csm1 mutants are in black, and Csm2 and Csm3 mutants are highlighted in yellow and cyan, respectively.

