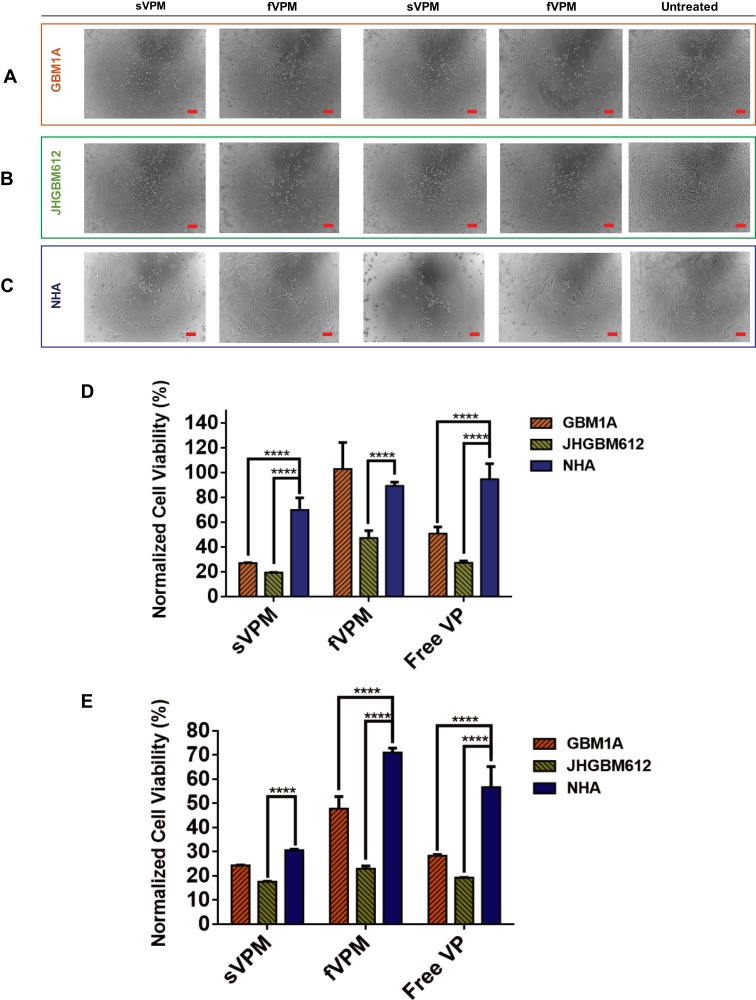
Figure 3.
NHA viability is significantly greater than patient-derived GBMs after free VP, sVPM, and fVPM treatments. (A–C) Representative brightfield images for corresponding cell types after 62.5 nM VP (left), 125 nM VP (center) and no treatment (right) (scale bar = 100 µm). (D and E) Consolidated normalized cell viability measurements at 62.5 nM (D) and 125 nM (E) VP treatment for all three tested cell types (n=4, mean ± SD, one-way ANOVA with Bonferroni’s multiple comparisons test (****p ≤ 0.0001)). Cells were normalized to untreated controls of the same cell type.

