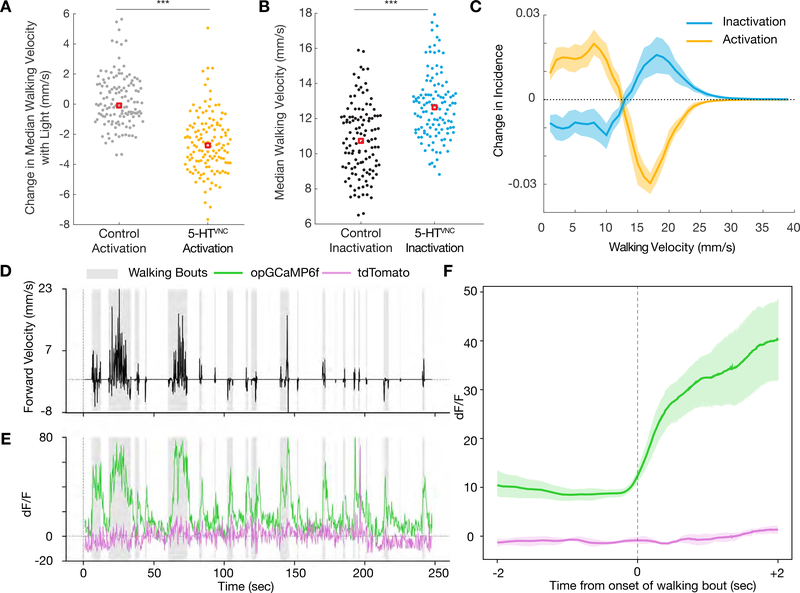
Figure 2. 5-HTVNC neurons modulate walking speed.
A. Activation of 5-HTVNC neurons (Trh ∩ tsh > csChrimson fed with ATR) causes animals to walk slower than background matched non-Gal4 controls (w1118 ∩ tsh >csChrimson fed with ATR). ***p<.001 by Kruskal-wallis test. Red box indicates median. N = 130 animals for each genotype.
B. Inactivation of 5-HTVNC neurons (Trh ∩ tsh > Kir2.1) causes animals to walk faster than background matched non-Gal4 controls (w1118 ∩ tsh > Kir2.1). ***p<.001 by Kruskal-wallis test. Red box indicates median. N=119 animals per genotype.
C. The distribution of velocity shifts caused by activation and inhibition of 5-HTVNC neurons are symmetrical. Differences in population average histograms were calculated between control and experimental genotypes and were fit with 95% confidence intervals via bootstrapping. For activation experiments, behavior of w1118 ∩ tsh >csChrimson flies fed with ATR was compared to that of Trh ∩ tsh >csChrimson flies also fed with ATR for the light on period only.
D, E. Serotonergic processes passing through the cervical connective (labeled using Trh ∩ tsh) are active during walking. (D) A single animal’s forward velocity with overlaid boxes showing defined walking bouts. (E) While tdTomato baseline signal (purple line) is not affected by walking bouts, the calcium signal (green line) in these serotonergic processes rises during walking bouts (gray boxes).
F. Calcium signal but not tdTomato signal in these processes rises with the onset of walking bouts. For each animal, all walking bouts were synchronized around their onset, and an average was taken (between 80 and 130 walking bouts per animal). Plotted is the average of all animals (N=5) with a 95% confidence interval representing the spread between animals.
See also Figures S2 and S3.

