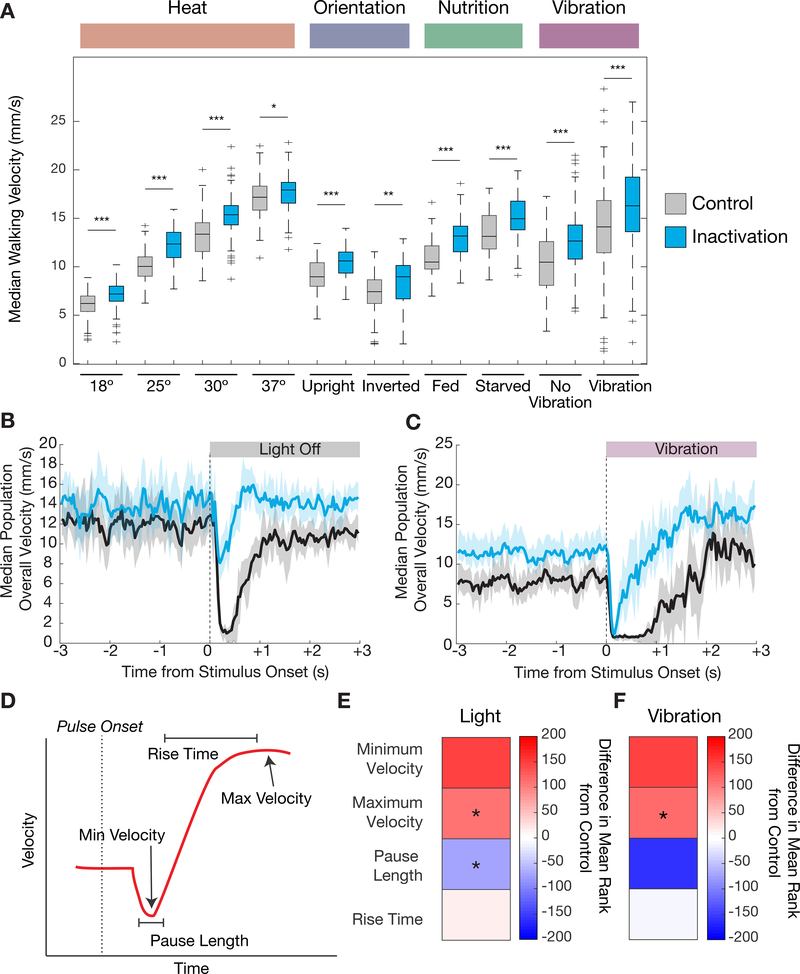
Figure 4. Changes in walking behavior when 5-HTVNC neurons are silenced.
A. Silencing 5-HTVNC neurons (Trh ∩ tsh > Kir2.1) causes an increase in walking speed compared to genetically background matched non-Gal4 controls (w1118 ∩ tsh > Kir2.1) across a diversity of behavioral contexts including different temperatures, orientations, nutritional states, and vibration stimuli. For each condition, genotypes were compared using a Kruskal Wallis test, ***p<.001, **p<.01, *p<.05 by Kruskal-wallis test. For all conditions, p<.001 for context effects for both control and experimental genotypes.18 °C, N=130 per genotype; 25 °C, N=120 per genotype; 30 °C, N=120 per genotype; 37 °C, N= w1118 (120) Trh (119); upright, N=90 per genotype; inverted w1118 (74) Trh (70); fed, N=86 per genotype; starved, N= w1118 (86) Trh (85); vibration, N= w1118 (165) Trh (164).
B-C. Silencing 5-HTVNC neurons changes the immediate behavioral responses to sudden contextual changes. When lights switch from on to off (B), control animals (w1118 ∩ tsh > Kir2.1, shown in black) show a brief behavioral pause and then resume activity. When 5-HTVNC neurons are silenced (Trh ∩ tsh > Kir2.1, shown in blue), animals still slow their speed but do not fully pause. In response to the onset of vibration (C) control animals stop, pause and then accelerate speed. When 5-HTVNC neurons are silenced (Trh ∩ tsh > Kir2.1, shown in blue), animals pause but re-accelerate more quickly than controls. Shaded areas show 95% confidence intervals. For light experiments, N= w1118 (150) Trh (140); for vibration experiments N=w1118 (167) Trh (166).
D. Schematic of behaviors in response to a sudden stimulus. This response is divided into four key parameters that describe different phases of the response, indicated with arrows and bounded lines.
E-F. Heatmaps quantifying the parameters schematized in (D) when 5-HTVNC neurons are inactivated in response to the blackout (E) and earthquake (f) scenarios. Plotted for every genotype is the difference in mean ranks (Kruskal-wallis test statistics) for each parameter compared to w1118 ∩ tsh > Kir2.1 control flies. Starred parameters are those where differences between control and experimental animals consistently reached significance (p<.05; see STAR Methods).
See also Figure S5.

