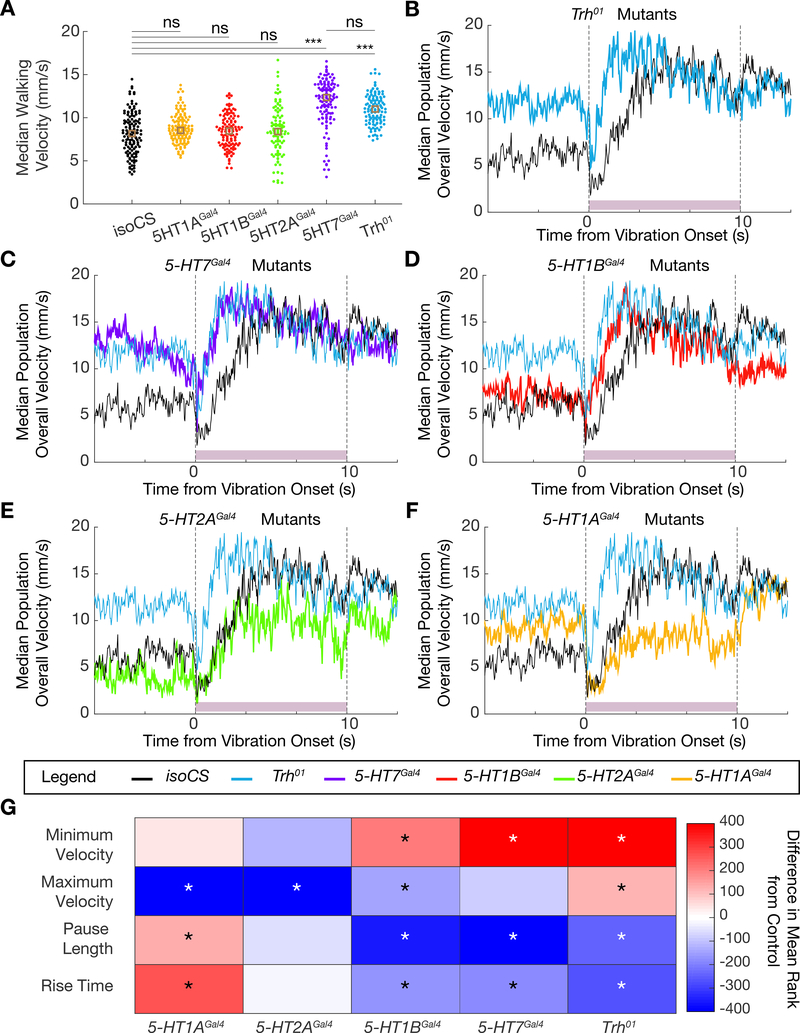
Figure 5. Phenotype of the startle response of Trh and serotonin receptor mutants.
A. Dotplot showing median population walking speed during a five-minute recording session for Trh01 mutants (blue), which walk faster than background matched isoCS controls (black), consistent with the 5-HTVNC inactivation experiments. 5-HT7Gal4 mutants (purple) also walk faster than controls, but the other receptor mutants do not. ***p<.001, **p<.01, *p<.05 ns p>.05 by Kruskal-wallis analysis with Dunn-sidak correction for multiple comparisons. Brown box indicates median. N= isoCS (130) 5-HT1AGal4 (130) 5-HT1BGal4 (120) 5-HT2AGal4 (100) 5-HT7Gal4 (120) Trh01 (120).
B-F. Median population walking speed sampled at 30 Hz in response to vibration stimulus. Trh01 mutants (B, blue line) show a blunted and shortened pause in response to the novel stimulus. 5-HT7Gal4 mutants (C, purple line) and 5-HT1BGal4 mutants (D, red line) show a similar phenotype to Trh01 mutants. 5-HT2AGal4 mutants (E, green line) and 5-HT1AGal4 mutants (F, yellow line) have a pause phase comparable to controls, but do not accelerate as much in response to the vibration stimulus. N= isoCS (140) 5-HT1AGal4 (115) 5-HT1BGal4 (124) 5-HT2AGal4 (88) 5-HT7Gal4 (120) Trh01 (139)
G. Heatmap showing how lack of Trh or serotonergic receptors affects the response to vibration stimulus. Plotted for every genotype is the difference in mean ranks (Kruskal-wallis test with Dunn-sidak correction for multiple comparisons statistics) for each parameter compared to isoCS control flies. Starred parameters are those where differences between control and experimentals consistently reached significance (p<.05, see STAR Methods).
See also Figure S5.

