
Fig. 2.
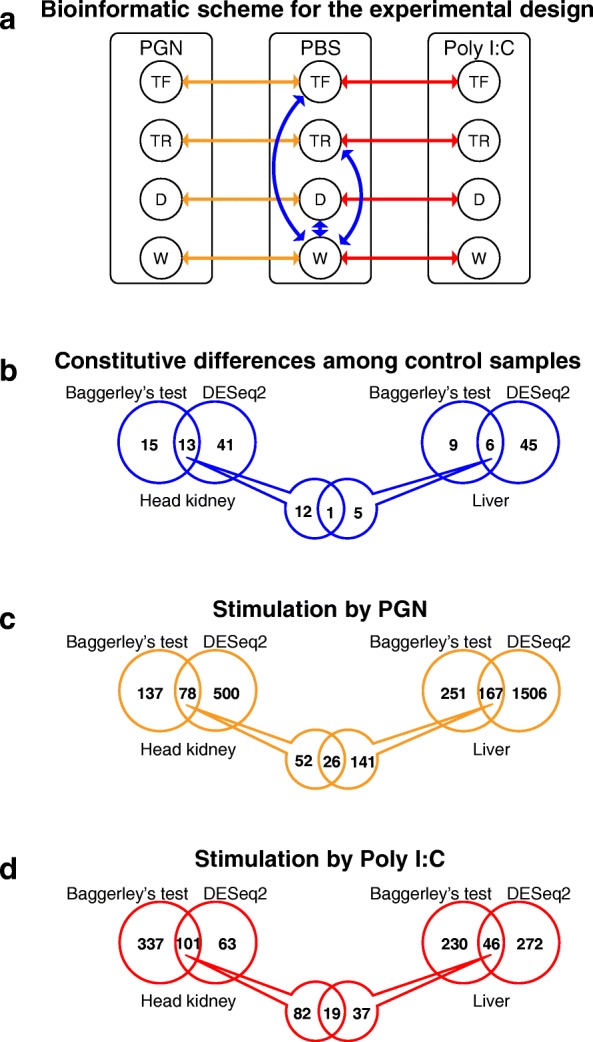
Bioinformatic analysis plan for the study. a) Pairwise assessment within each group, comparing immune-stimulated fish to their respective group treated with PBS, peptidoglycan (PGN) and Poly I:C. b) number of differentially expressed genes (DEGs) identified in the study by two different statistical normalized methods (Baggerley’s and DESeq2) treated with PBS, c0 peptidoglycan (PGN), and d) Poly I:C. Numbers refer to DEGs displaying a fold-change ≥3 among fish groups, with a normalized false discovery rate (FDR) P-value correction < 0.01). See Fig. 1 legend for abbreviations