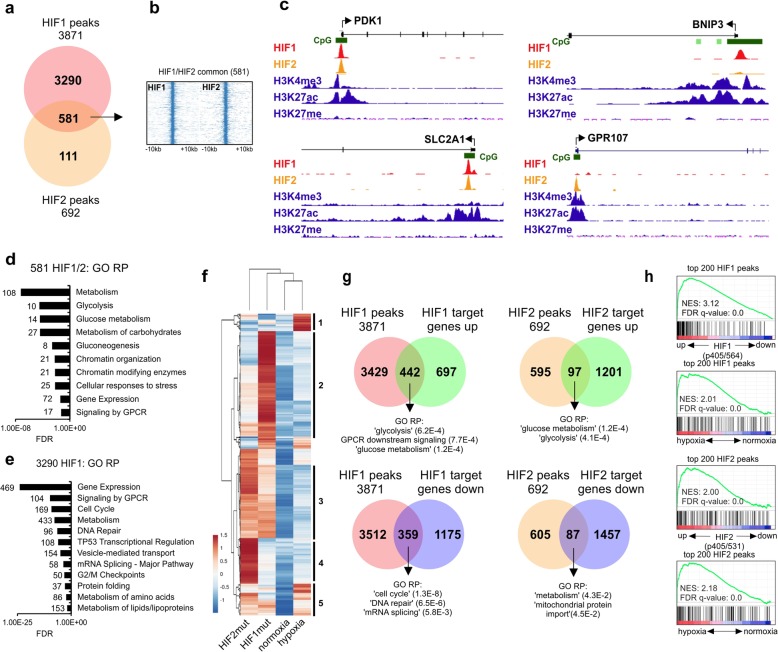
Fig. 1.
Identification of HIF1 and HIF2 chromatin binding sites in human leukemic cells. a. HIF1(P402A,P564A)-EGFP and HIF2(P405A,P531A)-EGFP fusions were expressed in K562 cells and anti-EGFP ChIPs were performed. VENN diagram depicts specific and overlapping peaks. H3K4me3, H3K27ac, and H3K27me3 K562 tracks were retrieved from Encode. b. Heatmaps of overlapping ChIP-seq peaks shown in a. c Left: representative examples of screenshots of loci bound by both HIF1 and HIF2, top right: representative screenshot of an HIF1-specific locus and bottom right: representative screenshot of an HIF2-specific locus. y-axis scales are set to 100 for HIF1 and HIF2, and to 50 for the other tracks. d–e GO analyses of gene loci bound by both HIF1/2 (f) or HIF1 only (g). f Supervised clustering of genes upregulated (> 2-fold) under hypoxia or upon overexpression of HIF mutants in K562 cells. 1, genes predominantly upregulated by hypoxia; 2, genes predominantly upregulated by HIF1; 3, genes predominantly upregulated by HIF1/HIF2; 4, genes predominantly upregulated by HIF2; 5, genes upregulated by HIH1/HIF2 and hypoxia. g Overlap in HIF-bound loci determined by ChIP seq and HIF-induced gene expression changes. Reactome Pathway GO analyses was performed on overlapping genes as indicated. h GSEA analyses showing good correlations between HIF binding and HIF-induced gene expression, as well as between HIF binding and hypoxia-induced gene expression

