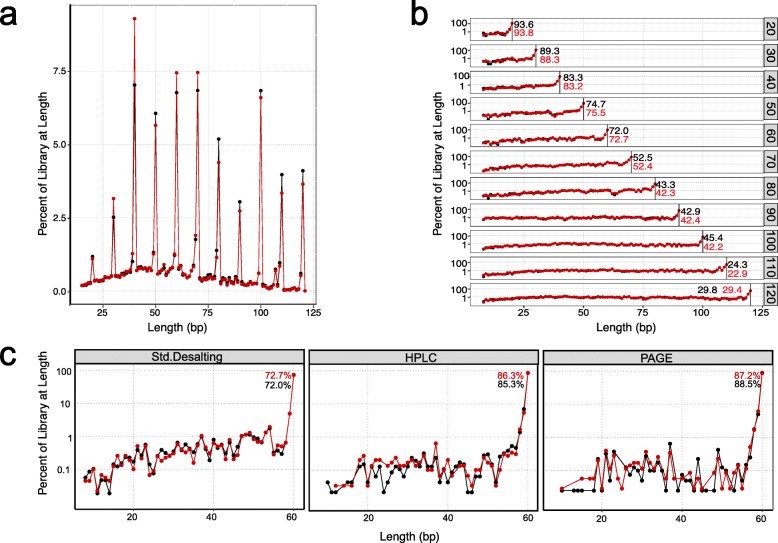
Fig. 4.
Single-stranded oligo analyses by the SRSLY method. Red and black lines and dots represent technical replicates (a) Insert distribution of equimolar pooled single-stranded oligo libraries. Oligos from 20 to 120 nt synthesized at 10 nt intervals were purified by standard desalting. Raw unfiltered sequencing data. (b) Mapped sequencing data for technical replicates separated by oligo. Represented as a function of oligo length. Black vertical bar and associated black and red numbers indicate percent of full-length product per oligo length present in the library pool. Each library was sequenced to a depth of ~ 100,000 read pairs (10,000 read pairs per oligo, excluding 20 and 30 nt lengths) (c) Effects for various purification methods on oligo purity as a function of oligo length for a 60 nt synthesized oligo. Associated black and red numbers indicate percent of full-length product per oligo. Data for the standard desalted 60 nt synthetic oligo pulled from (b)

