Fig. 5.
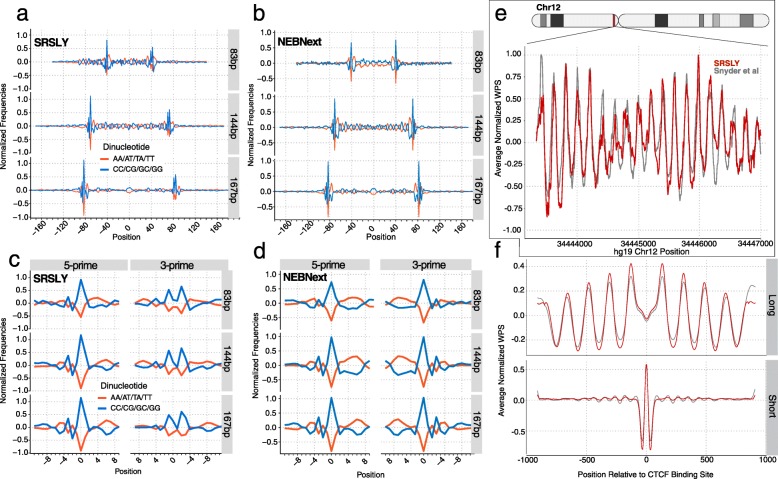
cfDNA analysis. (a) Normalized genomic dinucleotide frequencies as a function of read length for SRSLY data for three discrete fragment lengths including 100 bp ± the read mapped coordinates. Read midpoint is centered at 0. Negative numbers denote genomic regions upstream (5-prime) of the midpoint and positive numbers denote genomic regions downstream (3-prime) of the midpoint. Input data is from the combined H-69 and H-81 SRSLY datasets. (b) Same as (a) except for NEBNext data. (c) Normalized genomic dinucleotide frequency as a function of read length for SRSLY data for the termini of three discrete fragment lengths including a 9 bp region into the read (positive numbers) and 10 bp outside the read (negative numbers). Read start and end coordinates are centered on 0. Input data is from the combined H-69 and H-81 SRSLY datasets. (d) Same as (c) except for NEBNext data. (e) Normalized WPS values (120 bp window; 120–180 bp fragments) for SRSLY data compared to sample CH01 [16] at the same pericentromeric locus on chromosome 12 used to initially showcase WPS. (f) Average normalized WPS score within ±1 kb of annotated CTCF binding sites for long fragment length binned data (120 bp window, 120–180 bp fragments) and short fragment length binned data (16 bp window, 35–80 bp fragments) for SRSLY data compared to sample CH01 [16]

