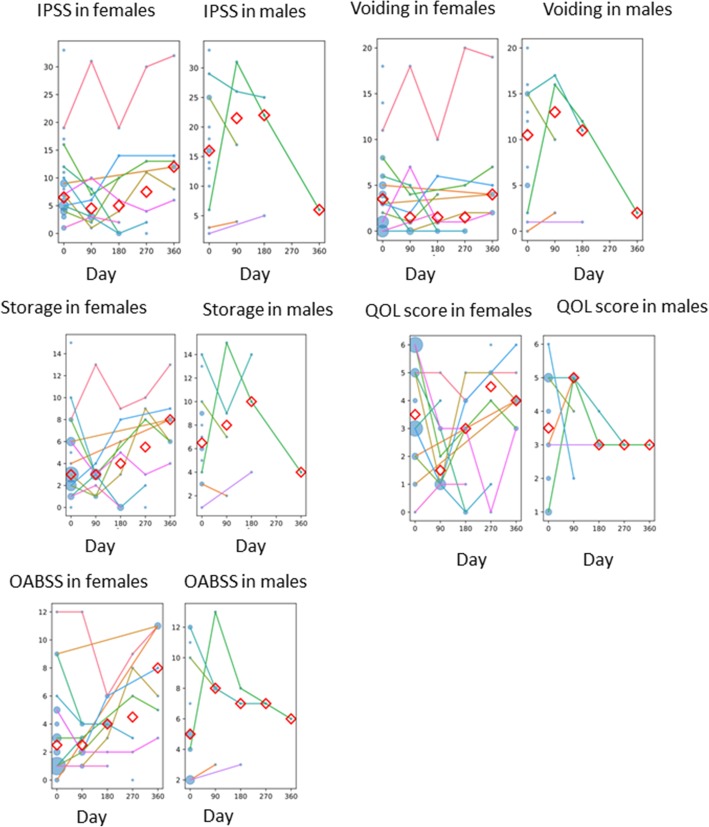
Fig. 4.
IPSS, storage, and voiding symptom subdomains and the OABSS before and after the insertion of a Resonance stent. After the insertion, symptoms were reported every 3 months for 12 months. Values from individual patients are shown by lines. The red diamonds represent the median at each time point (days from intervention). The size of each circle represents the number of patients. Males, n = 16; females, n = 30

