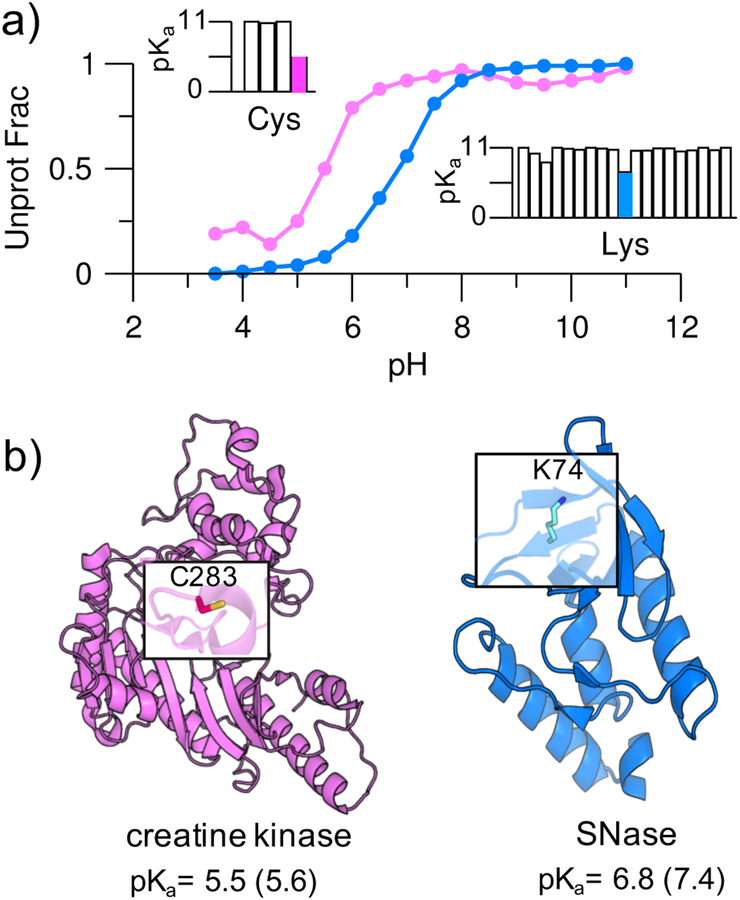
Figure 2. Simulations reproduced highly downshifted pKa’s of cysteine and lysine.
a) Simulated titration curves for Cys283 in creatine kinase (magenta) and Lys74 in the V74K mutant SNase (blue). In the insets, the calculated pKa’s of all cysteines (Cys283 in magenta) in creatine kinase and all lysines (Lys74 in blue) in the mutant SNase are given. For clarity, pKa’s above 11 are shown as 11 (complete pKa’s are given in Table S3). b) Structures of creatine kinase (PDB: 1I0E) and the V74K mutant SNase (PDB: 3RUZ). Cys283 and Lys74 are highlighted; their calculated and experimental31, 32 pKa’s (in parentheses) are given.

