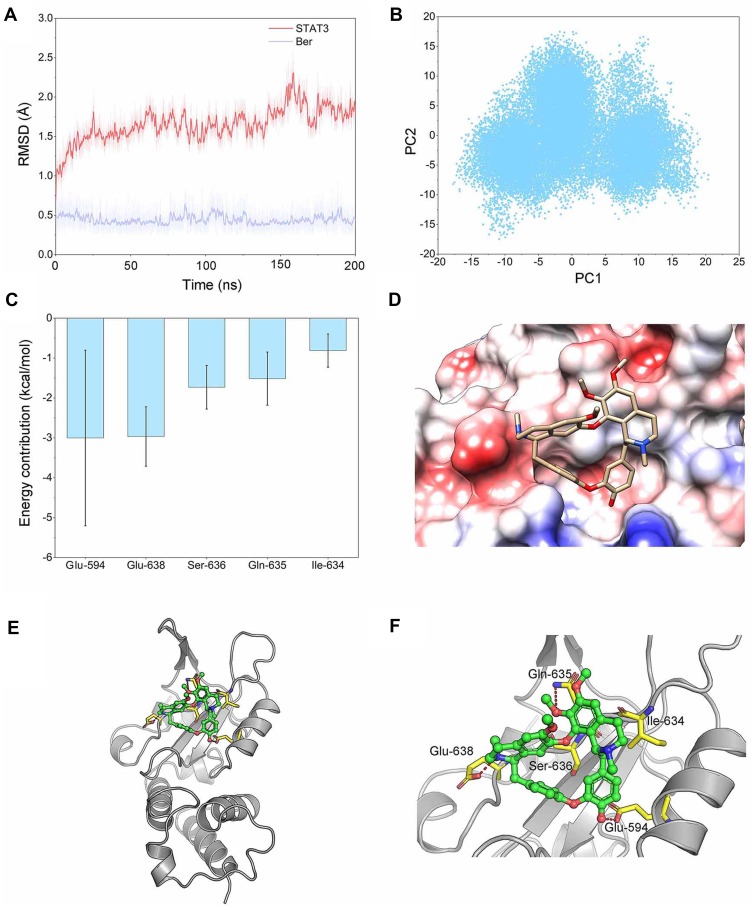
Figure 6.
Structural and energetic analysis of BBM’s SH2 field of STAT3. (A) RMSD curves for the 200 ns MD simulation of STAT3 SH2 domain backbone and heavy atoms of BBM. (B) PCA scatter plot along the first two main components in the MD simulation. (C) Most five contributed residues between STAT3 SH2 domain and BBM; (D) Electrostatic molecular potential surface of STAT3 SH2 domain bound to BBM. Electronegative potential (red), electropositive potential (blue), and neutral potential (white). (E) Overview of the binding patterns between STAT3 SH2 domain and BBM; (F) A detailed view of the most five contributing residues between STAT3 SH2 domain and BBM, hydrogen bond interaction (red).

