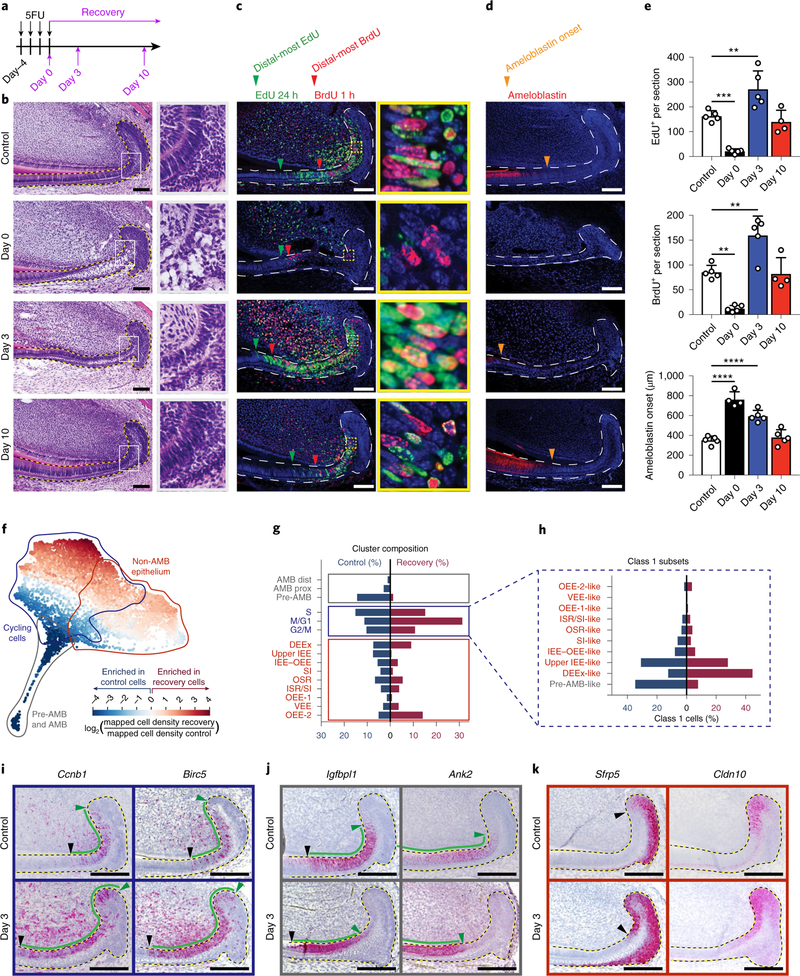
Fig. 6 |. Single-cell transcriptomic analysis reveals changes in cell cycle and differentiation program after injury.
a, Schematic of 5FU treatment and sample collection timepoints during recovery. b–d, Control and 5FU-treated mice were analysed at the indicated timepoints using haematoxylin and eosin (H&E) staining (b), EdU and BrdU labelling (c), or ameloblastin immunostaining (d). Green and red arrowheads indicate the most distal EdU-labelled and BrdU-labelled cells, respectively, and orange arrowheads indicate the onset of ameloblastin expression. Boxed areas (grey in b, yellow in c) are magnified (b, ×3.7; c, ×9.1) on the right. e, Quantification of EdU+ and BrdU+ cells persection and the distance of ameloblastin expression onset from the proximal edge of the laCL are quantified from control or 5FU-treated mice; n = 5 animals, except for ameloblastin at day 0 and EdU and BrdU at day 10, for which n = 4 mice. For the bar charts, data are mean ± s.d. Normally distributed data were analysed using parametric tests including one-way ANOVA with Tukey–Kramer post hoc test. Significance was taken as P < 0.05 with a confidence interval of 95%. f, SPRING plot of injury and control cells coloured by the fold change in density between the two conditions. g, The proportion of cells in each population defined in control (blue) and recovery (red) conditions. h, Cycling-cell subset size for control and recovery conditions. i–k, RNAscope staining for markers of class 1 cycling cells (i), class 2 pre-ameloblasts (j), and markers of class 3 cells in control (top) and recovery day 3 (bottom) samples (k). For b and i–k, dashed lines outline the epitehlium. For b–d and i–k, scale bars, 100 μm.

