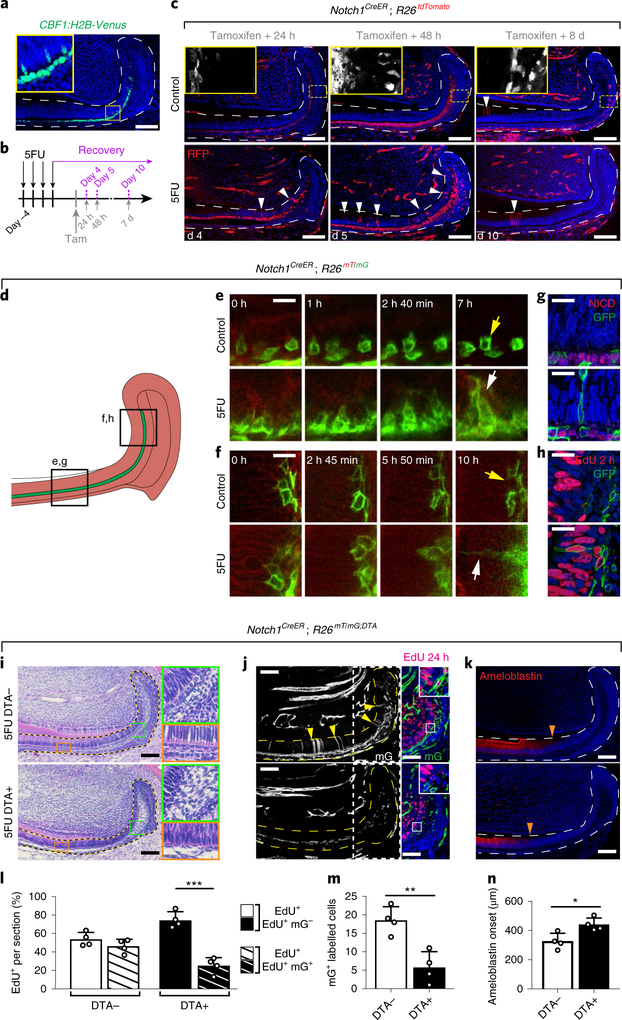
Fig. 7 |. Si cells undergo direct conversion to ameloblasts to contribute to the recovery of injured incisor epithelium.
a, Notch1 pathway activity was assessed using the CBF1:H2B-Venus reporter. b, Schematic of 5FU treatment, tamoxifen induction and sample collection timepoints of Notch1CreER; R26tdTomato mice. c, During recovery, Notch1-expressing cells contribute to the regeneration of wounded dental epithelium. Incisors from control (top row) and 5FU-treated (bottom row) mice were analysed at the indicated timepoints after tamoxifen injection. The white arrowheads indicate traced cells that have entered the proliferating region of the IEE–ameloblast layer. Areas indicated by yellow boxed areas are magnified (×4.1) on the top-left, in which tdTomato+ cells are shown in white without DAPI staining. d, Schematic of explant time-lapse imaging. e,f, Two-photon time-lapse live imaging shows the movement of Notch1-expressing cells during 8 h (ameloblast region; e), or 10 h (IEE region; f) of culture (Supplementary Videos 1–4). g, NICD (red) and GFP (green) immunostaining in control Notch1CreER; R26mT/mG mice (top) and Notch1CreER; R26mT/mG mice at recovery day 5 (bottom), 48 h after tamoxifen induction. h, EdU (red) and GFP (green) immunostaining in control Notch1CreER; R26mT/mG mice (top) and in Notch1CreER; R26mT/mG mice at recovery day 5 (bottom), 48 h after tamoxifen induction. i–n, Ablation of Notch1-expressing cells impaired normal recovery after injury with 5FU. DTA+ (Notch1CreER; R26RmT/mG; RosaDTA/–) and DTA– mice were examined at recovery day 7 using H&E (i), EdU and GFP (j), and ameloblastin immunostaining (k). Areas indicated by green (×4) orange (×4) and yellow (×3.5) boxes are magnified. Areas indicated by white boxed on the left panels in j, are shown with EdU and GFP staining on the right panels. The yellow arrowheads indicate traced cells that have entered the proliferating region of the IEE or the ameloblast layer. The orange arrowheads indicate the onset of ameloblastin expression. The number of proliferating cells (i), cells descended from Notch1-expressing progenitors in the ameloblast or IEE layers (m) and the distance of ameloblastin expression onset from the proximal edge of the laCL (n) are quantified from DTA+ or DTA− mice injured by treatment with 5FU; n = 4 animals. For bar charts, data are mean ± s.d. Normally distributed data were analysed using parametric tests including one-way ANOVA with Tukey–Kramer post hoc test. Significance was taken as P < 0.05 with a confidence interval of 95%. For a, c and i-k, dashed lines outline the epitehlium. For a, c and g–k, scale bars, 100 μm. For e and f, scale bars, 10 μm.

