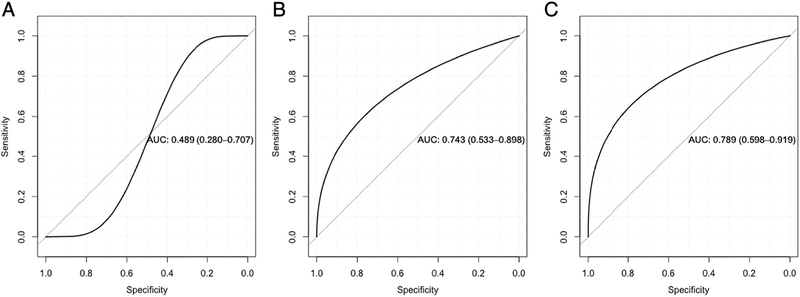
Fig. 1.
Receiving operating characteristic curves display AUC and 95% CI, and demonstrate predictive performance of three different models on the classification of coronary atherosclerosis determined by histological assessment using the Stary Score Classification System. (A) Model 1: EATPC, (B) Model 2: LDL-C and hsCRP, (C) Model 3: LDL-C, hsCRP, and EATPC. AUC: area under the curve, CI: confidence interval, EAT: epicardial adipose tissue, EATPC: gene expression signature of EAT differentially expressed genes, LDL-C: low-density lipoprotein cholesterol, hsCRP: high sensitive C-reactive protein.

